

A drone survey used to end with a folder of files and a printed report. Useful, but most of it was never opened again. Every survey we fly now comes with an online farm dashboard: one login where the whole survey lives, is easy to read, and can be asked questions in plain language.
This post is a quick tour of what you see when you log in. Each part has its own post with more detail, linked below. The screenshots are from a real 9-acre shade-lopped coffee estate in Kodagu, surveyed in July 2026.
The tabs at a glance
| Tab | What it shows | Read more |
|---|---|---|
| Farm Profile | Every block measured: true acres, slope, aspect, canopy and tree height | Farm Profile |
| Ask about this farm | Questions in plain language, answered from the survey and your records | How the AI reads drone data |
| Media Map | All map layers, photos and video on one interactive map you can draw on | Drone Media Map |
| 3D Terrain | The bare ground in 3D, with rain flow and sun and shade simulations | 3D Terrain |
| Point Cloud | A true-colour 3D digital twin of the estate | Digital Twin |
| Records | Ground data you add: harvest records, mapped trees, notes | Records |
Farm Profile: the estate in numbers
The first thing you see is the farm as a set of blocks, each drawn on the drone map in its own colour, with the figures that matter next to it.
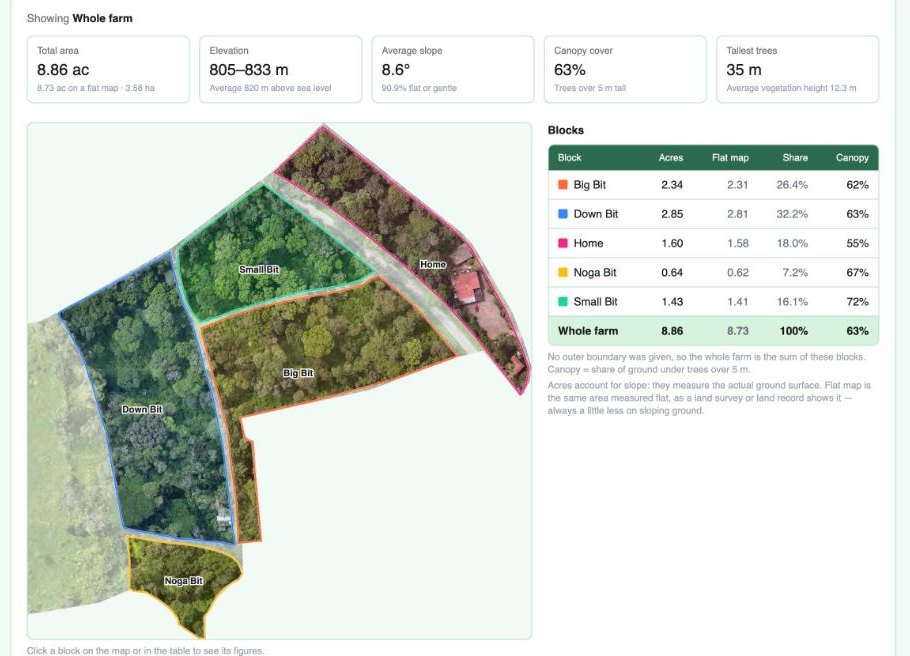 Total area corrected for slope, elevation, average slope, canopy cover and tree height, for the whole farm and for each block.
On this estate, the five blocks add up to 8.86 acres of actual ground, a little more than the 8.73 acres a flat map shows, because the land slopes. 63% of the farm is under canopy taller than 5 m. Tap a block and every figure switches to that block. More on the Farm Profile.
Ask about this farm: questions, not files
Above the profile sits a question box. Type a question the way you’d ask a farm manager, and the assistant answers from this farm’s survey and any records you’ve added, with the blocks coloured on the map and a table underneath.
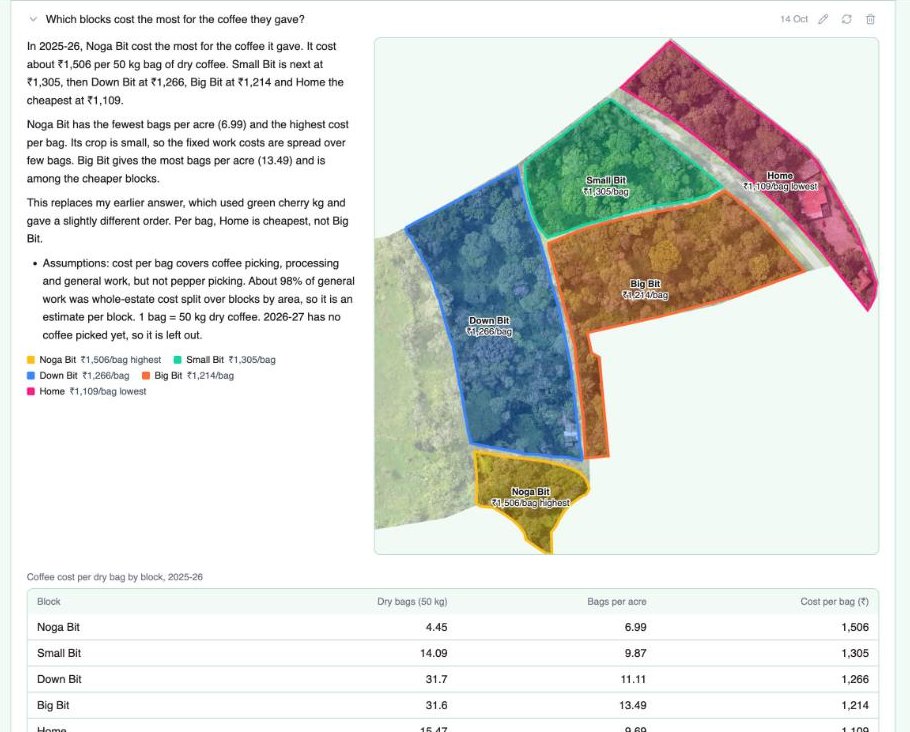 “Which blocks cost the most for the coffee they gave?” The answer joins the season’s harvest and cost records from ThotaTracker to the surveyed blocks.
This is where a drone survey becomes more than a map. When the estate also keeps its daily records in ThotaTracker, the same blocks carry the harvest, the work and the costs, so you can ask about yield per acre, cost per bag, or whether the steeper blocks give less coffee. How the AI reads drone data.
Media Map, 3D Terrain and Point Cloud: the survey itself
The next three tabs hold the survey outputs, each opening right inside the dashboard, with Share and Full screen buttons.
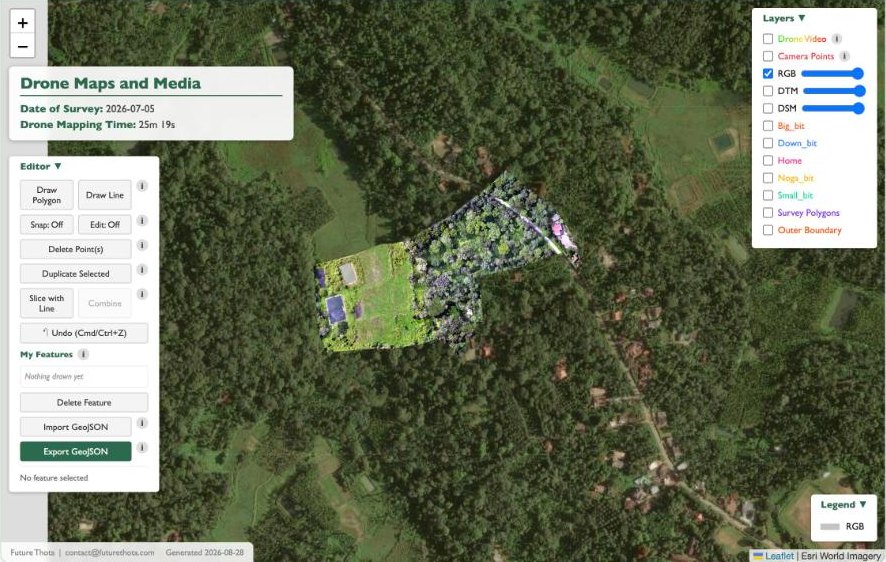 The Media Map stacks the aerial photo, elevation models, blocks, photos and flight video on one map.
- Media Map: the aerial photo, terrain and surface models, block outlines, and every drone photo pinned where it was taken. You can draw your own blocks and export them.
- 3D Terrain: the bare ground as a 3D model, with a rain simulation and a sun-and-shade simulation through the day and the seasons.
- Point Cloud: millions of measured points in true colour, a digital twin you can rotate and zoom into.
Records: the ground data
The last tab holds what the drone can’t see: harvest and cost records, trees mapped on the ground, notes. Each upload gets a short explanation of every column and a block-by-block summary, and the assistant reads it all. More on Records.
How long you keep it
The dashboard is included free for the first year with every Basic Drone Mapping Package, and can be renewed yearly after that. Your survey data stays with us for a year.
If you’d like a dashboard like this for your own estate, get in touch.