
The aerial photo shows your estate from straight above. The Point Cloud tab of the farm dashboard shows it from every other angle. It is a digital twin of the land: millions of points, each measured by the survey and coloured with the real colour from the drone’s photos.
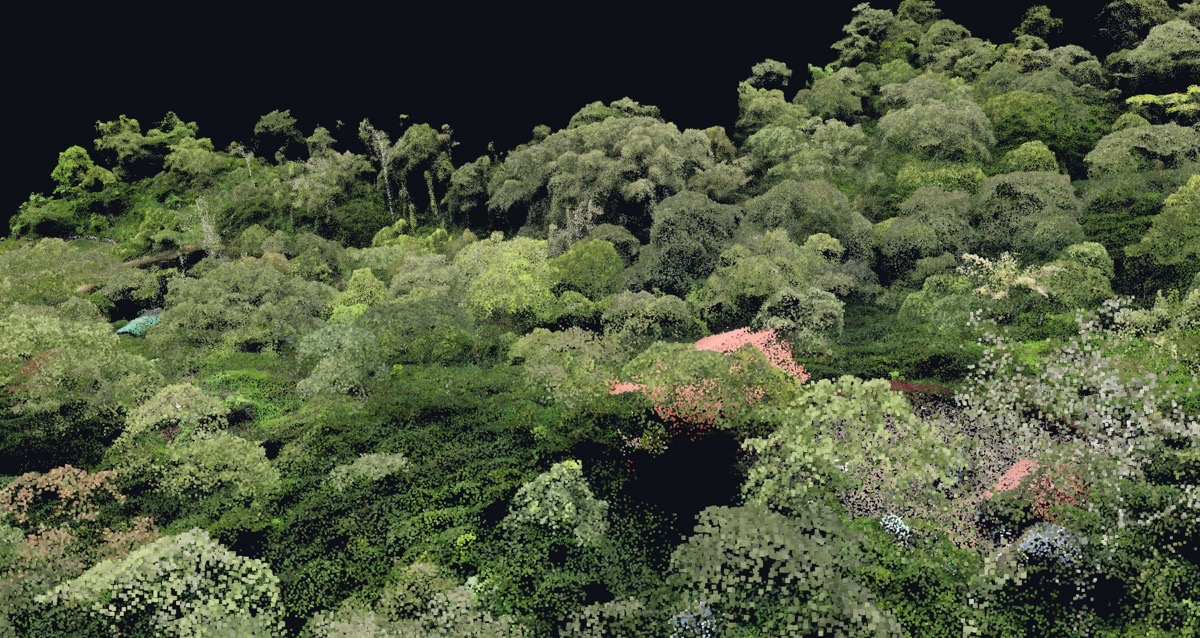 A digital twin from one of our surveys: tree crowns, canopy layers and buildings, seen at an angle.
What you can see
Because every point has a height, the canopy stops being a flat green carpet. You can see:
- Individual tree crowns, and how tall each one stands over the coffee.
- The canopy layers: the coffee bushes, the lower shade trees and the tall over-storey, one above the other.
- Gaps in the shade, where the canopy has thinned or a tree has fallen.
- Buildings, roads and yards, in their real shape and height.
Rotate to any angle, zoom in anywhere, and look under the tall trees from the side.
What it’s useful for
- Shade management: see which shade trees are crowding the coffee and which gaps need planting, before deciding on lopping.
- Checking a block on screen: look at a corner of the estate you rarely walk to.
- Showing the estate: to family who live away, to a buyer who wants to see where their coffee grows, or to a bank or insurer.
- A dated record: the estate exactly as it stood on the survey date, to compare with a later survey.
The measurements behind the twin also feed the canopy cover and vegetation height figures in the Farm Profile, so the numbers and the 3D view always agree.
Next: Records, where ground data joins the survey, or back to the dashboard tour.