

The Media Map is the working map of your survey. It’s the second tab of the farm dashboard, and it puts everything the drone captured on one interactive map in your browser, with nothing to install.
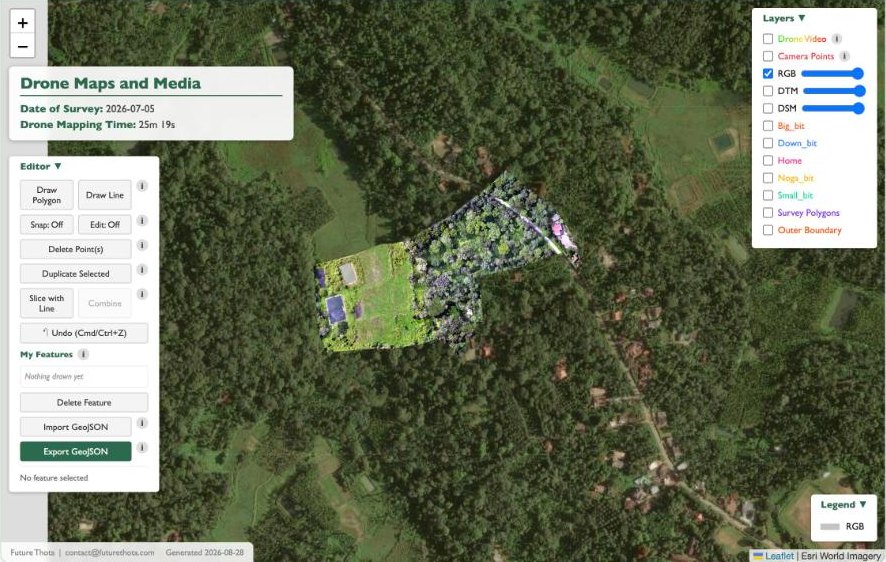 The survey’s aerial photo sits over satellite imagery of the surrounding area. Layers on the right, drawing tools on the left.
All the map layers, stacked
The Layers list on the right switches each layer on or off, and the main ones have an opacity slider:
- RGB: the aerial photo (orthomosaic), stitched from hundreds of overlapping drone images. Far sharper than satellite imagery: you can see individual tree crowns, paths and roofs.
- DTM: the digital terrain model, the bare ground with the trees removed. It shows the real shape of the land under the canopy.
- DSM: the digital surface model, the top of everything: tree crowns, buildings and the ground where it’s open.
- Blocks: each block outline in its own colour, the same colours used across the dashboard.
- Survey polygons and the outer boundary.
Slide the RGB layer half transparent over the DTM and you can see how the ground under a block rises and falls. We explain these layers in more depth in Reading the Land: Five GIS Layers Every Plantation Survey Should Include.
Photos and video, where they were taken
Two more layers turn the map into a media library:
- Camera points: every drone photo, placed where it was taken. Click a point to open the photo.
- Drone video: the flight video, linked to the map.
A survey photo of a block is far easier to find this way than by scrolling through a folder of numbered images.
Mark it up yourself
The Editor panel lets you draw on the map: polygons for new blocks or areas, lines for paths and drains. You can snap to existing edges, slice a block in two with a line, duplicate or delete features, and undo. Everything you draw can be exported as GeoJSON, a standard map file that any GIS software can read. You can also import GeoJSON you already have.
This is how blocks are agreed: draw them on the real aerial photo, check them on the ground, and the same outlines then carry through to the Farm Profile, the assistant and your harvest records.
Share it
Every map in the dashboard has a Share button and a Full screen view. Share the map with a family member, a manager, or a buyer who wants to see where the coffee comes from.
Next: the 3D Terrain tab, or back to the dashboard tour.