

Ask an estate owner how big each block is and the answer usually comes from an old land record, a guess handed down, or a figure nobody quite trusts. The Farm Profile is the first tab of the farm dashboard, and it replaces those guesses with measurements from the drone survey: area, slope, aspect, canopy and tree height, for the whole farm and for every block.
The example below is a 9-acre shade-lopped coffee estate in Kodagu with five blocks.
The headline figures
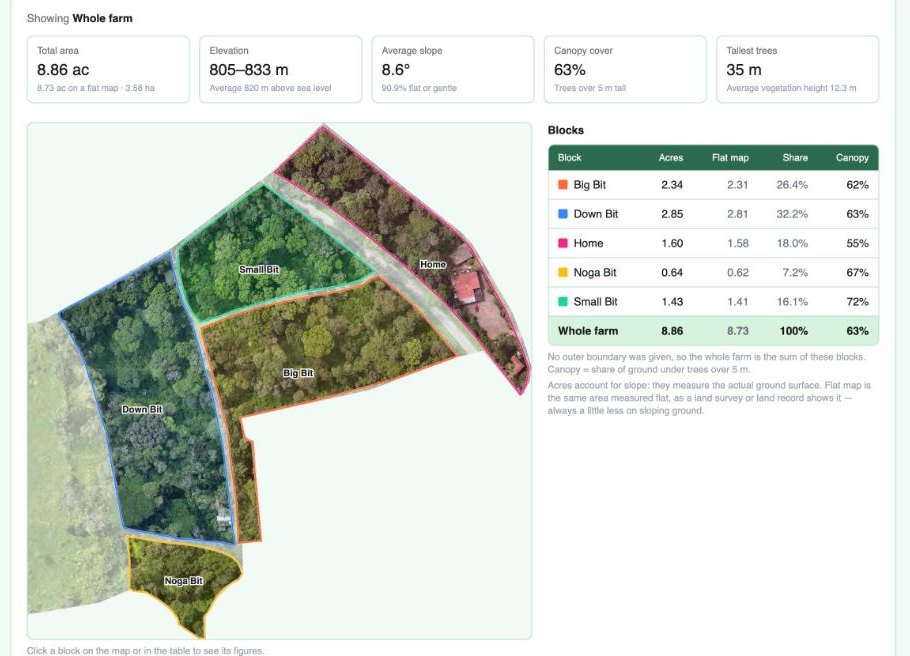 Five cards across the top, the blocks on the drone map, and the block table on the right.
Across the top are five cards:
- Total area: 8.86 acres of actual ground (8.73 acres on a flat map, 3.58 ha).
- Elevation: 805 to 833 m, averaging 820 m above sea level.
- Average slope: 8.6°, with 90.9% of the land flat or gentle.
- Canopy cover: 63% of the ground is under trees taller than 5 m.
- Tallest trees: about 35 m, with an average vegetation height of 12.3 m.
Click a block on the map or in the table, and every card switches to that block’s figures.
Why there are two areas
The block table shows two acreages side by side: Acres and Flat map. A land record measures area as if the land were flat. On sloping ground, the actual surface you plant, weed and pick is larger. The survey measures that real surface using the terrain model, so every table on the page adds up to the true total.
On this gentle estate the difference is small: 527 sq m, or 0.13 acres (1.5%). On steeper land it grows quickly, which matters when you compare yield per acre or work cost per acre between blocks.
The block table also shows each block’s share of the farm and its canopy: here, Small Bit has the most shade (72%) and Home the least (55%).
Slope, aspect and vegetation height
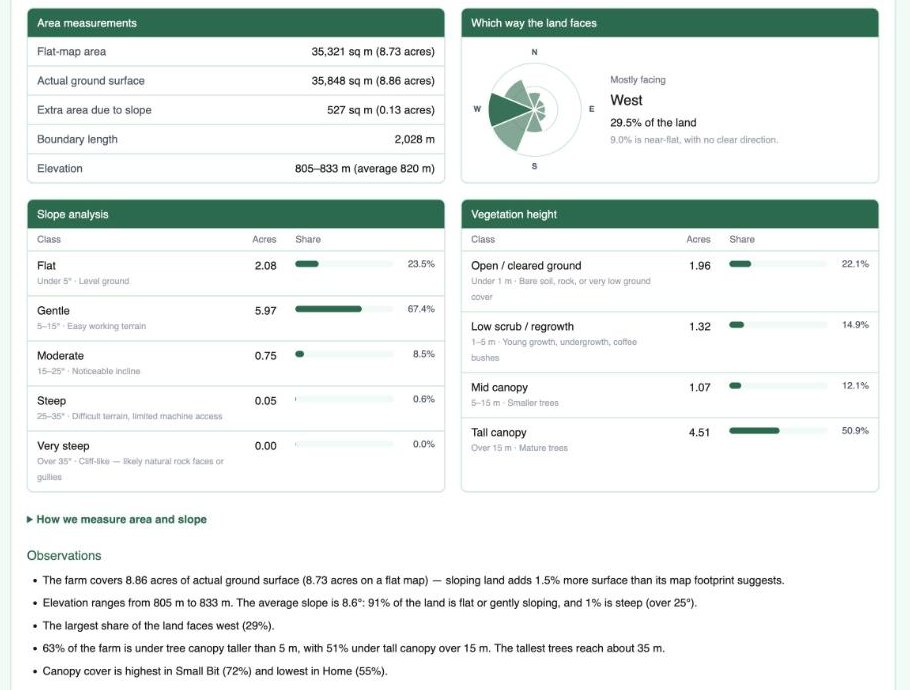 Below the map: area measurements, which way the land faces, slope classes and vegetation height classes.
Further down are four panels:
- Area measurements: flat-map area, actual ground surface, the extra area due to slope, boundary length and elevation range.
- Which way the land faces: a rose chart of aspect. This farm mostly faces west (29.5% of the land), with 9% near-flat. Aspect affects how much afternoon sun a block gets, and how quickly it dries after rain.
- Slope analysis: acres in each class, from Flat (under 5°) through Gentle, Moderate and Steep to Very steep (over 35°). Here, two thirds of the land is gentle, and only 0.05 acres is steep.
- Vegetation height: open ground, low scrub and coffee bushes (1 to 5 m), mid canopy (5 to 15 m) and tall canopy (over 15 m). Half this farm is under tall canopy, as you would expect for shade-grown coffee.
Vegetation height comes from subtracting the bare-ground terrain model from the drone’s surface model, so it measures the trees themselves rather than the hill they stand on.
Observations in plain words
At the bottom, the dashboard writes out the main points as short sentences, for example: “Canopy cover is highest in Small Bit (72%) and lowest in Home (55%).” They are a quick summary to share with a family member or a manager who won’t read the tables.
What it’s useful for
- Fair comparisons between blocks. Yield, labour and input costs per true acre, not per guessed acre.
- Shade management. Canopy and tree height by block show where shade lopping or replanting of shade trees is due.
- Planning work. Slope classes show where machines can go and where work will be slower.
- Land records. A dated, measured record of the estate’s blocks and boundaries.
These same block figures are what the assistant uses when you ask a question about the farm. See how the AI reads drone data, or go back to the dashboard tour.