

A drone sees the land. It can’t see what each block gave last season, what the weeding cost, or which pepper vines are worth the climb. That comes from the ground. The Records tab of the farm dashboard is where ground data joins the survey, so the assistant can read both together.
The examples below come from a 9-acre coffee and pepper estate in Kodagu with three record sets: a season summary per block, a detailed log per block, and 270 mapped pepper trees.
Harvest and cost records, block by block
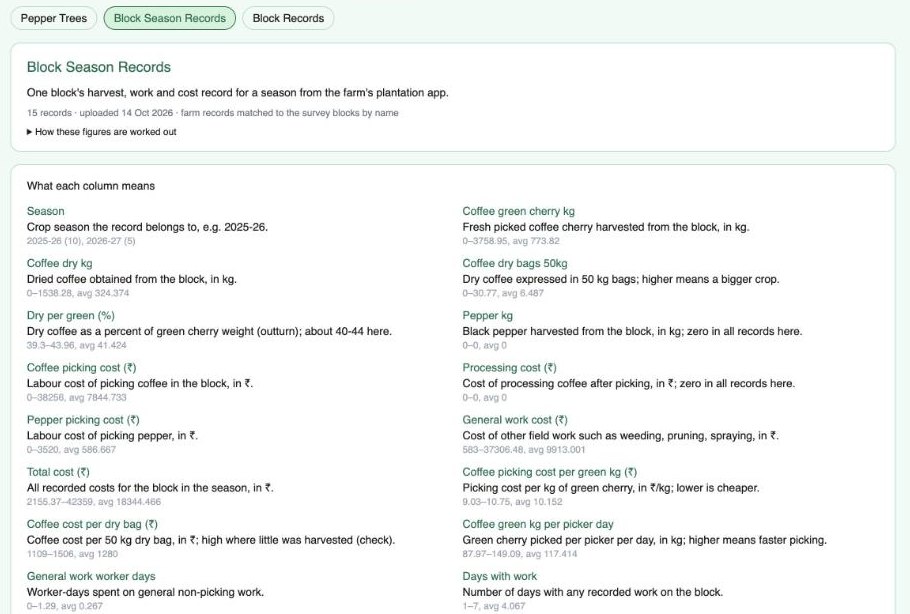 Block Season Records: one row per block per season, from the estate’s own plantation records.
This estate keeps its daily records in ThotaTracker: every day’s picking weights, the work done and paid, drying, and the bags that were sold. Those records are summed up per block and per season and matched to the surveyed blocks by name. For each block and season you get:
- Green cherry kg picked, dry kg and dry bags (50 kg), and dry as a percentage of green.
- Coffee picking cost, general work cost, pepper picking cost and the total cost.
- Working figures such as cost per dry bag, picking cost per green kg and green kg per picker per day.
The dashboard writes a plain explanation of every column, with its range and average, and How these figures are worked out explains the method: for example, how dry coffee from a batch is traced back to the blocks it was picked from, and how work recorded for the whole estate is shared between blocks by area.
With these records in place, questions like “Which block gave the most coffee per acre last season?” or “Do the steeper blocks give less coffee?” can be answered from the survey and the harvest together. See three real examples in how the AI reads drone data.
For yield by block, the harvest needs to be recorded block by block, either by entering the block with each day’s picking, or by GPS-tracking where the picking happened.
Trees mapped on the ground
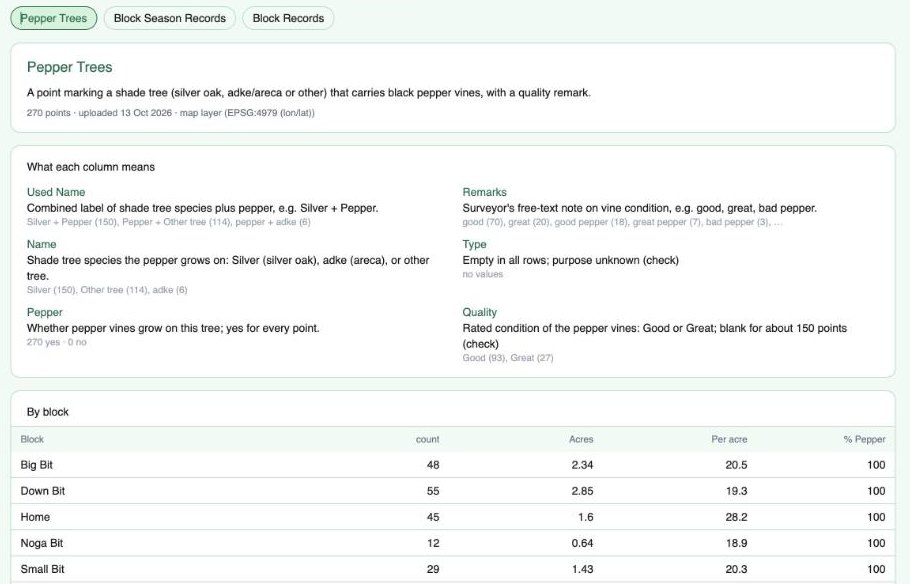 270 shade trees carrying pepper, each a GPS point with its species and a quality rating, counted by block.
Some things are best recorded tree by tree. On this estate, every shade tree carrying black pepper was mapped with a GPS point, the tree species (silver oak, areca or other) and the condition of the vines (Good or Great). Uploaded as a map layer, each point falls inside a surveyed block, and the dashboard counts them per block and per acre.
Points outside the surveyed blocks are kept and listed separately, and the assistant points out what is missing, such as trees that were never rated.
What you can add
Records can be any table or map layer tied to the estate’s blocks or locations:
- Harvest, work and cost records exported from ThotaTracker.
- Trees, wells, drains, boundary stones or problem spots mapped with GPS.
- Soil test results or rainfall by block.
- Notes on each block.
Every record set is explained in plain words when it’s added, and becomes something the assistant can answer from.
Air plus ground
The survey gives the shape of the estate once. Ground records keep growing every day, every season. Put together, they become a complete picture of the plantation, and the more you record, the more useful questions you can ask of it.
Back to the dashboard tour.