

A drone survey tells you a great deal about the land: how big each block is, how steep, how shaded, which way it faces. Your harvest book tells you what each block gave and what it cost. The useful questions sit in between, and they’ve always needed someone to sit down with both and work it out.
The Ask about this farm box in the farm dashboard does that. You type a question in plain words. The assistant reads this farm’s survey, the blocks, and any ground records you’ve added, and answers with the blocks coloured on the map and a table underneath.
Here are three real questions from a 9-acre coffee and pepper estate in Kodagu.
1. “Which blocks cost the most for the coffee they gave?”
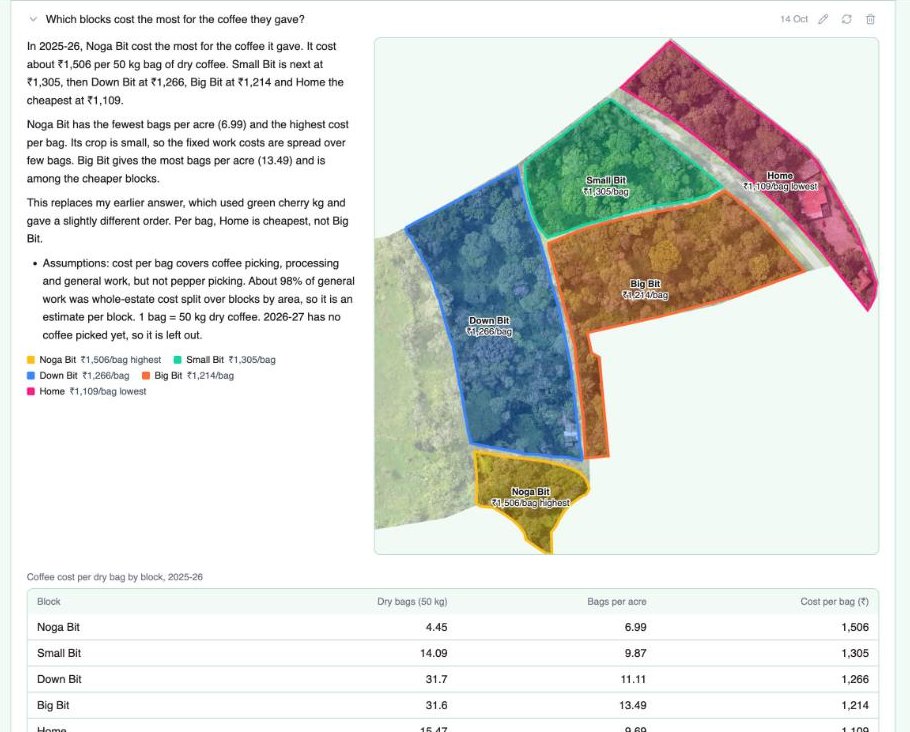 Cost per dry bag by block for the 2025-26 season. The harvest and cost records come from ThotaTracker; the acres come from the survey.
This one needs both halves. The estate records its daily picking, work and costs in ThotaTracker, and those records are matched to the surveyed blocks by name. The answer:
- Noga Bit cost the most, about ₹1,506 per 50 kg bag of dry coffee. It also gave the fewest bags per acre (6.99), so its fixed work costs are spread over very few bags.
- Big Bit gave the most bags per acre (13.49) and is among the cheaper blocks.
- Home was the cheapest at ₹1,109 per bag.
The answer also states its assumptions: what the cost includes (picking, processing and general work, not pepper picking), that about 98% of general work was recorded for the whole estate and split over blocks by area, so it’s an estimate per block, and that the new season has no coffee picked yet so it’s left out.
That honesty matters. A good analyst tells you how sure they are, and so does this one.
2. “Where should I make a road to collect the coffee during harvest?”
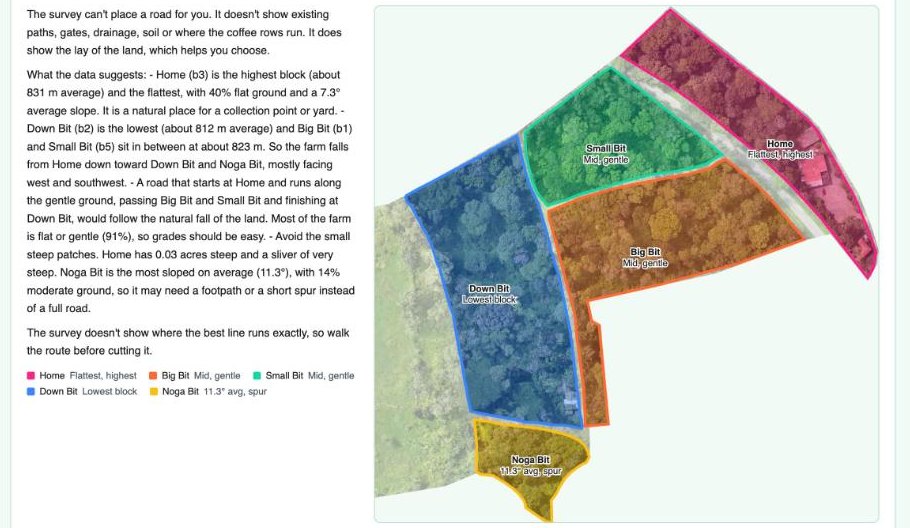 Answered from the terrain model alone: height, slope and the fall of the land, block by block.
This is a question only the drone data can help with. The assistant starts by saying what the survey can’t see: existing paths, gates, drainage, soil, or where the coffee rows run. Then it uses what the survey does show, the lay of the land:
- Home is the highest block (about 831 m) and the flattest, with 40% flat ground, so it’s a natural place for a collection point or yard.
- Down Bit is the lowest (about 812 m), with Big Bit and Small Bit in between, so the farm falls from Home towards Down Bit and Noga Bit.
- A road from Home along the gentle ground, past Big Bit and Small Bit to Down Bit, follows the natural fall of the land. 91% of the farm is flat or gentle, so the grades should be easy.
- Noga Bit is the most sloping block (11.3° on average), so a footpath or short spur may serve it better than a full road.
And it ends with the right advice: walk the route before cutting it.
3. “Which block has the best pepper, and how should I assign my pickers?”
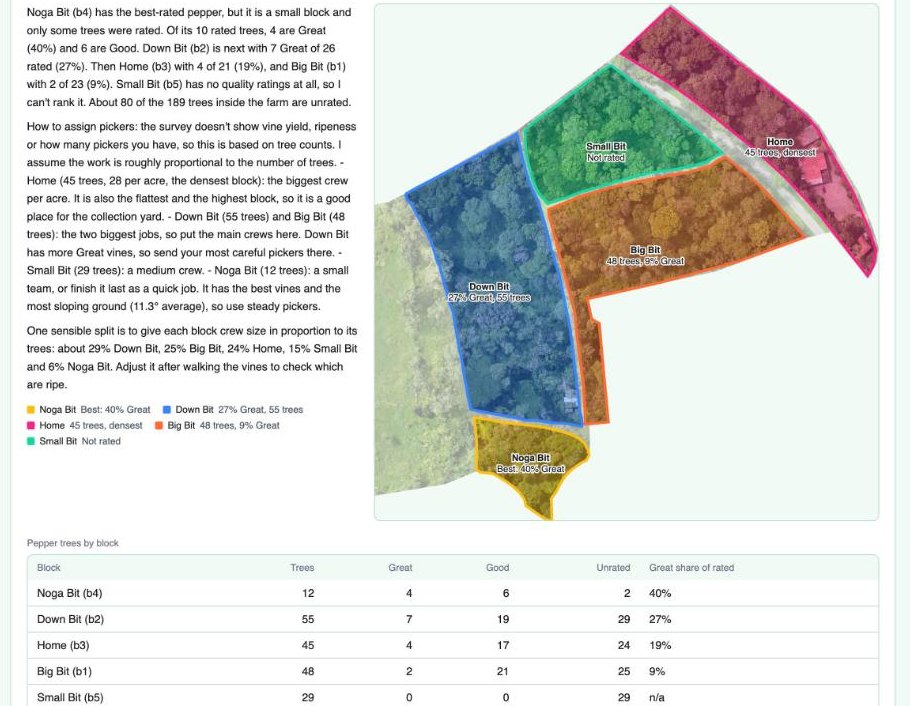 Answered from 270 pepper-carrying shade trees, each mapped on the ground with a quality rating.
On this estate, every shade tree carrying pepper was mapped with a GPS point and a quick rating (Good or Great). Uploaded to the dashboard’s Records, those points fall inside the surveyed blocks, and the assistant can count and compare them:
- Noga Bit has the best-rated pepper (4 of its 10 rated trees are Great), but it’s a small block with few rated trees. Down Bit is next, with 7 Great out of 26 rated.
- About 80 of the 189 trees inside the farm have no rating, and Small Bit has none at all, so it can’t be ranked. The answer says so.
- For pickers, it splits crews in proportion to the trees in each block: about 29% to Down Bit, 25% Big Bit, 24% Home, 15% Small Bit and 6% Noga Bit. It suggests the most careful pickers for Down Bit, which has more Great vines, and steady pickers for sloping Noga Bit.
How the assistant reads your farm
Under the question box, a panel called How the assistant reads your farm shows the rules it follows, so nothing is hidden:
- General rules for every farm, for example: yield is reported as dry coffee first, in 50 kg bags; a season runs October to September; costs shared by a picking day are split between blocks by kilograms picked; and it should say when the data is thin.
- Your farm notes, in your own words: what you call each block, how crews are paid, what “outturn” means locally. The assistant follows your notes over the general rules, and ThotaTracker’s assistant uses the same notes, so both speak your language.
What leaves the dashboard
Answers are written by AI (Claude, from Anthropic). To answer, the question and the farm’s figures are sent to Anthropic: block names, block-by-block summaries of the data layers, and notes in any uploaded records. Your name, email, farm name, location and images are not sent, and Anthropic doesn’t train its models on this data. Answers are saved in the dashboard so you can come back to them, edit a question, or ask again. As with any analyst, check anything important before acting on it.
Ask better questions with better data
The assistant can only be as good as what it knows about the land. The survey gives it the shape of the estate. Your ground records give it everything that happens there. The more you record, the harder the questions it can answer: yield by block over several seasons, whether shadier blocks give less coffee, which work costs the most and where.
The human part stays yours: deciding what to ask, and what to do with the answer.
Back to the dashboard tour, or see what you get from a drone survey.