

A drone survey produces a terrain model and a surface model. On their own, those are just elevation data. Run them through analysis, and they turn into five distinct layers that tell you where to focus attention on the ground — without walking the whole estate first.
Canopy Height Model (CHM)
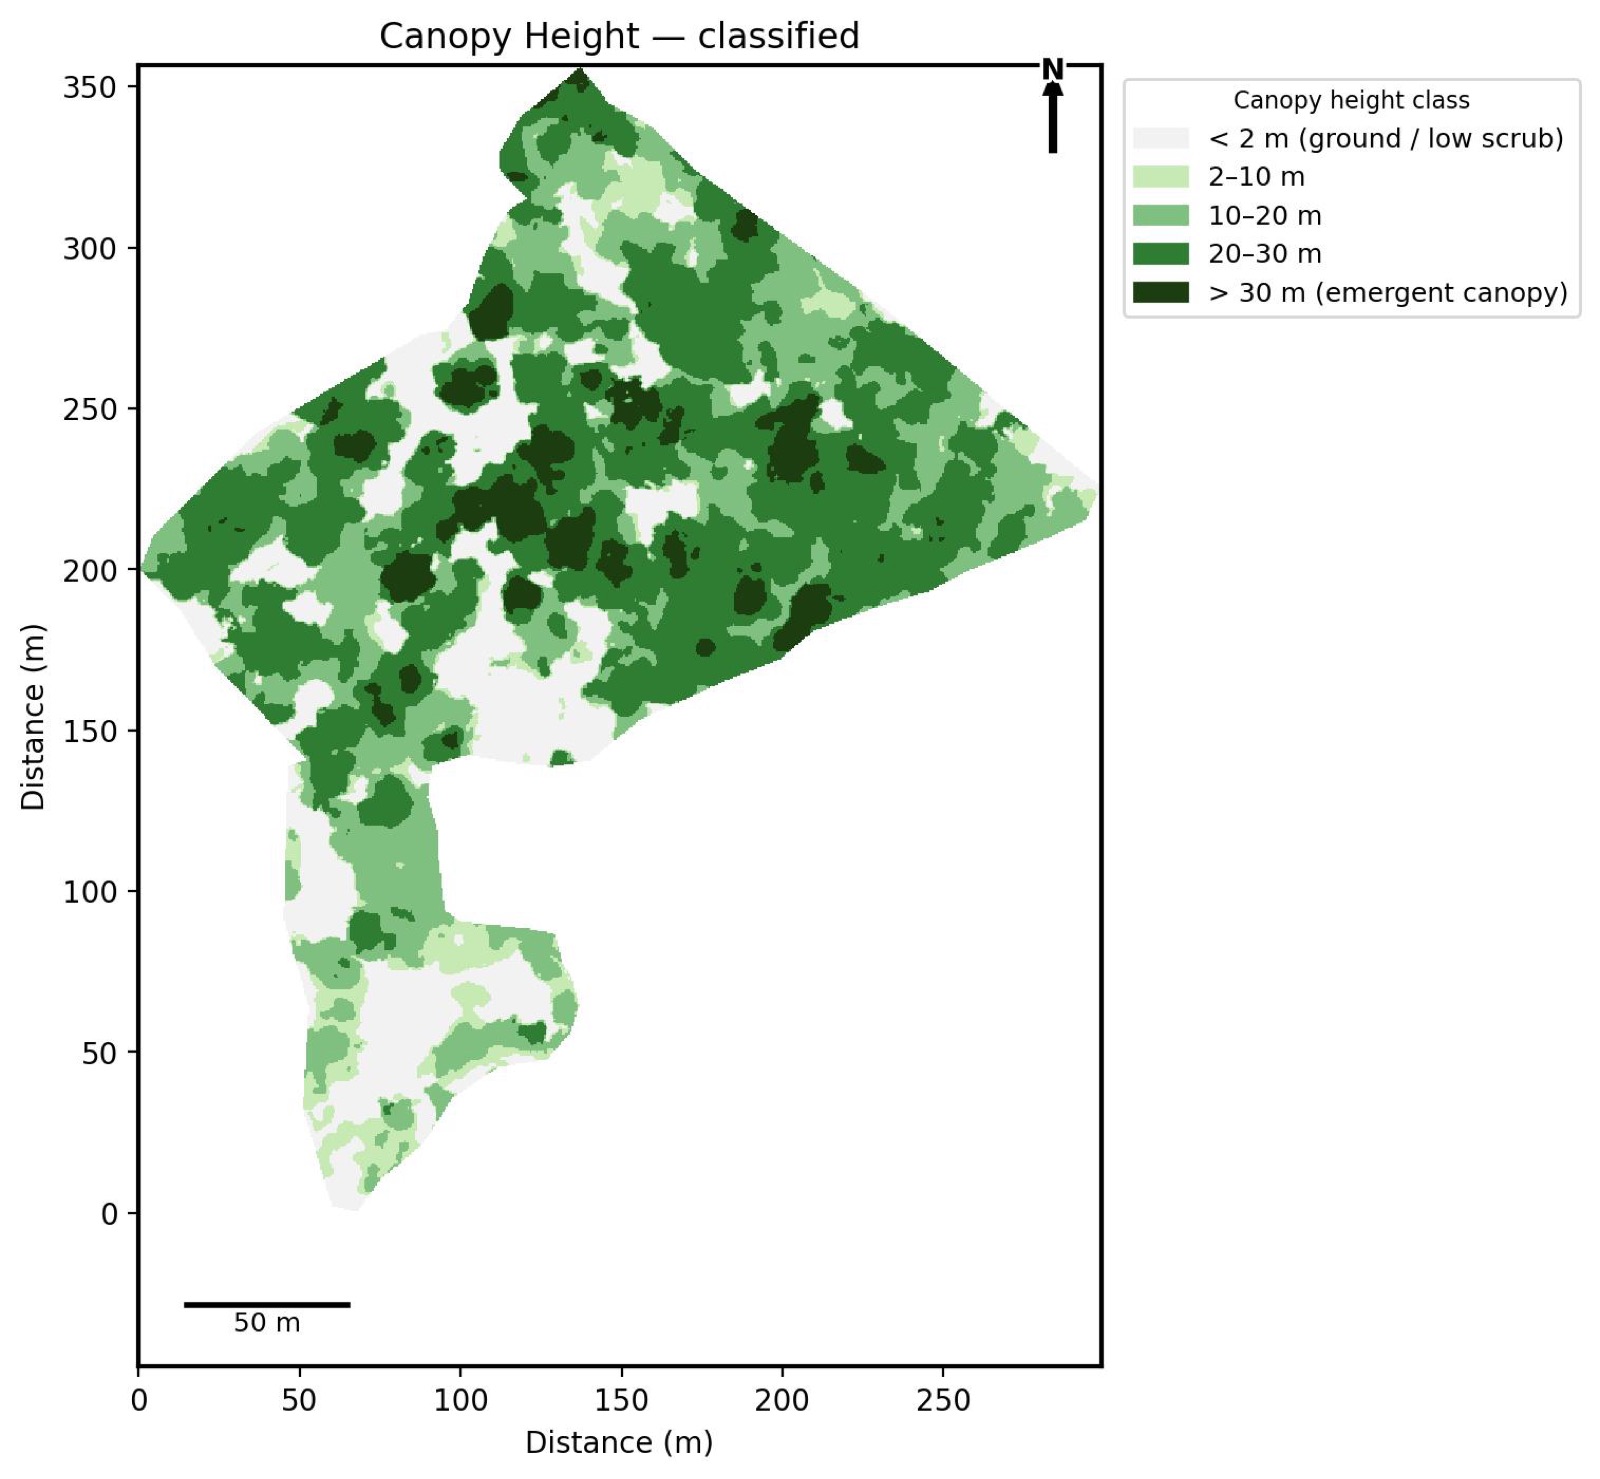
The CHM is the DSM minus the DTM: canopy height, classified into bands, mapped across the entire estate. On a shade-grown coffee estate this is directly useful for shade management — spotting zones of over-shade that are suppressing yield, or under-shade zones that need more canopy cover. It’s also the layer behind individual tree height and stand-density work.
Slope
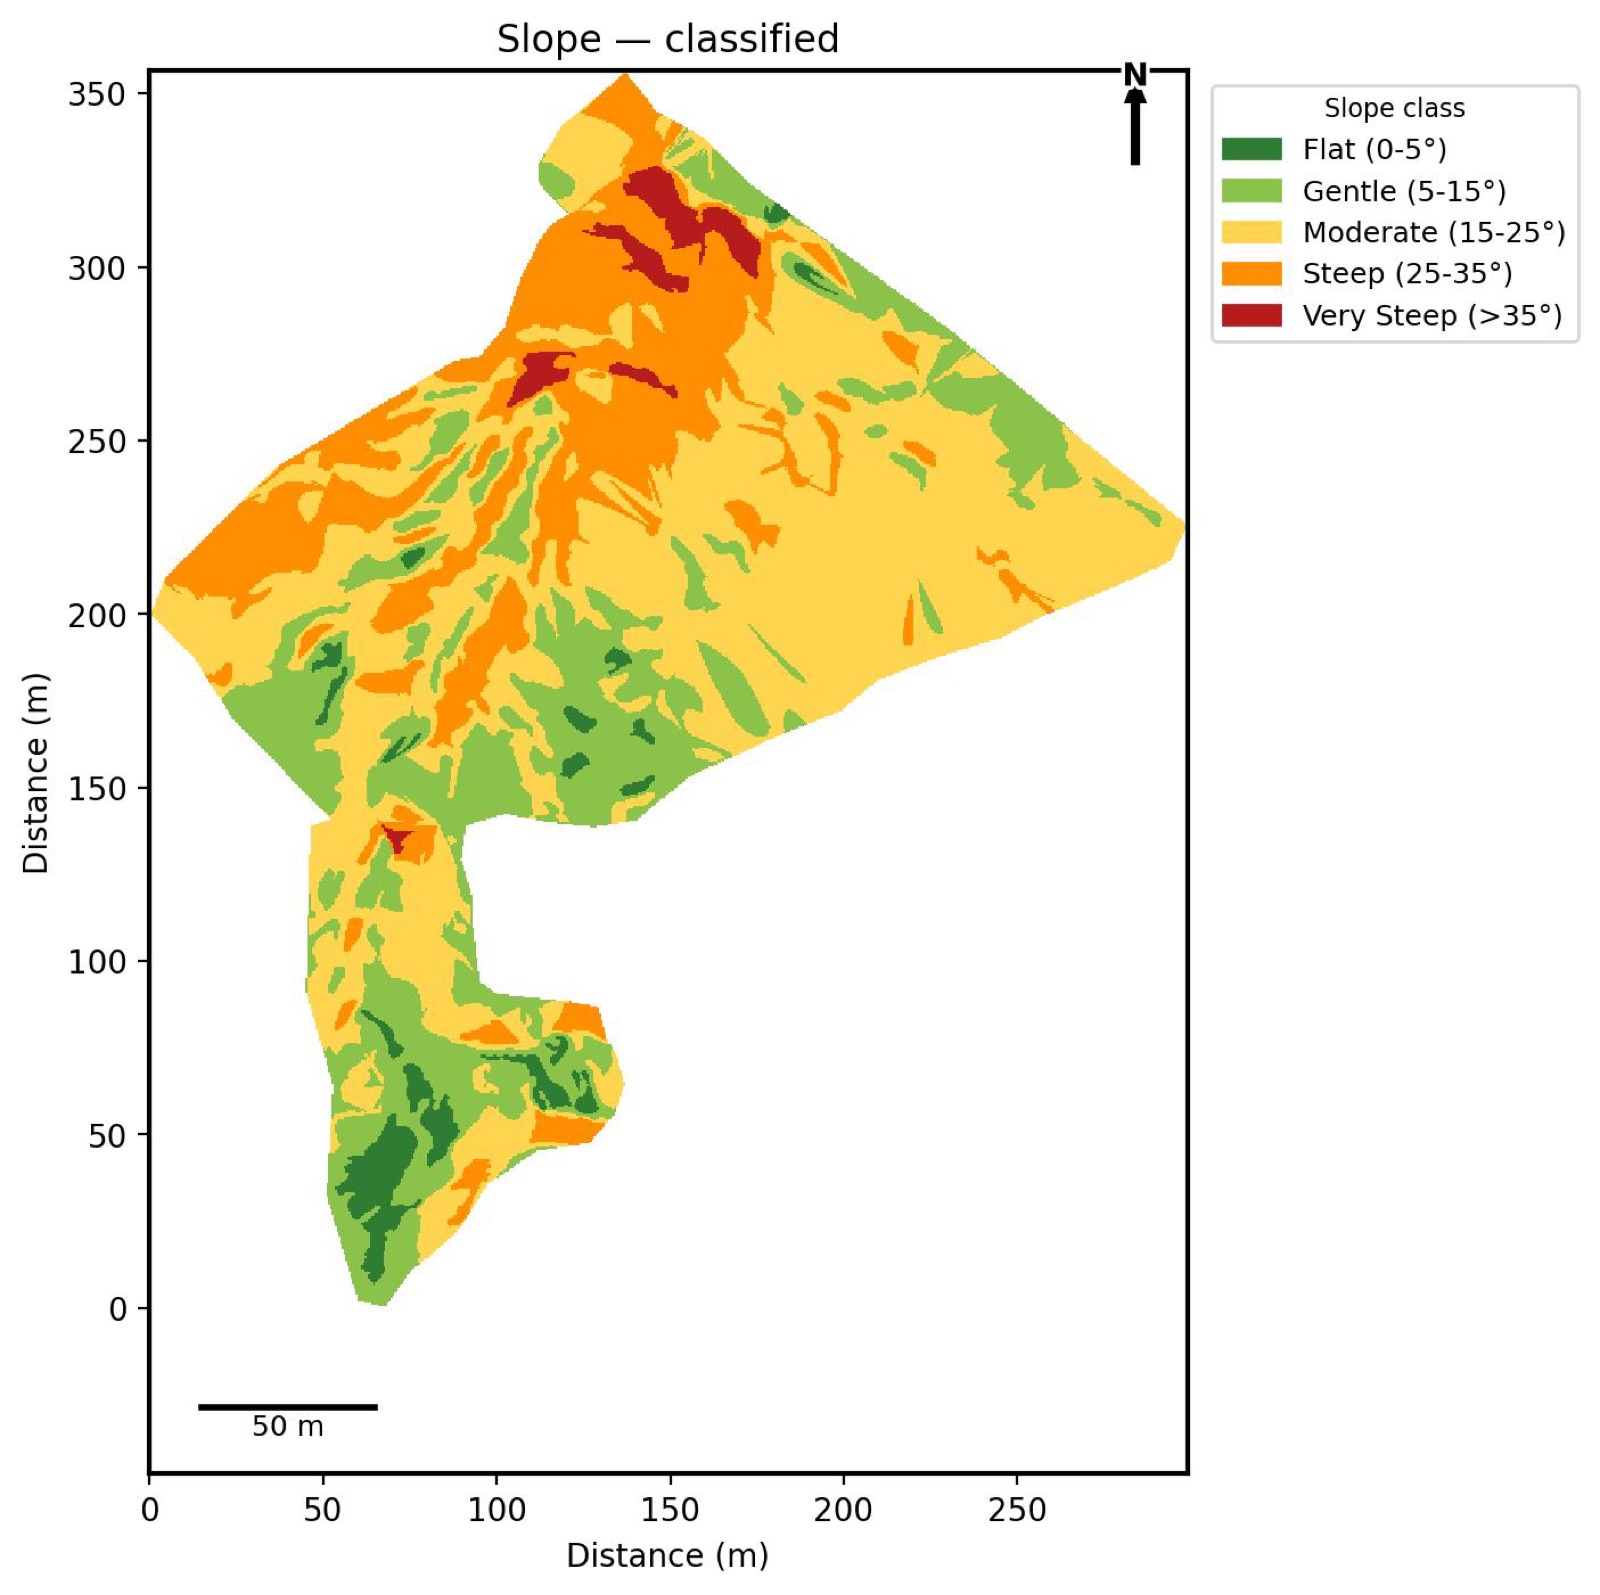
Derived directly from the DTM, the slope layer classifies terrain steepness across the estate. Beyond the obvious use in slope-corrected area calculations (a flat measurement understates true surface area on hilly ground), slope is the first input for erosion risk, terracing decisions, and drainage line planning.
Soil Wetness (Topographic Wetness Index)
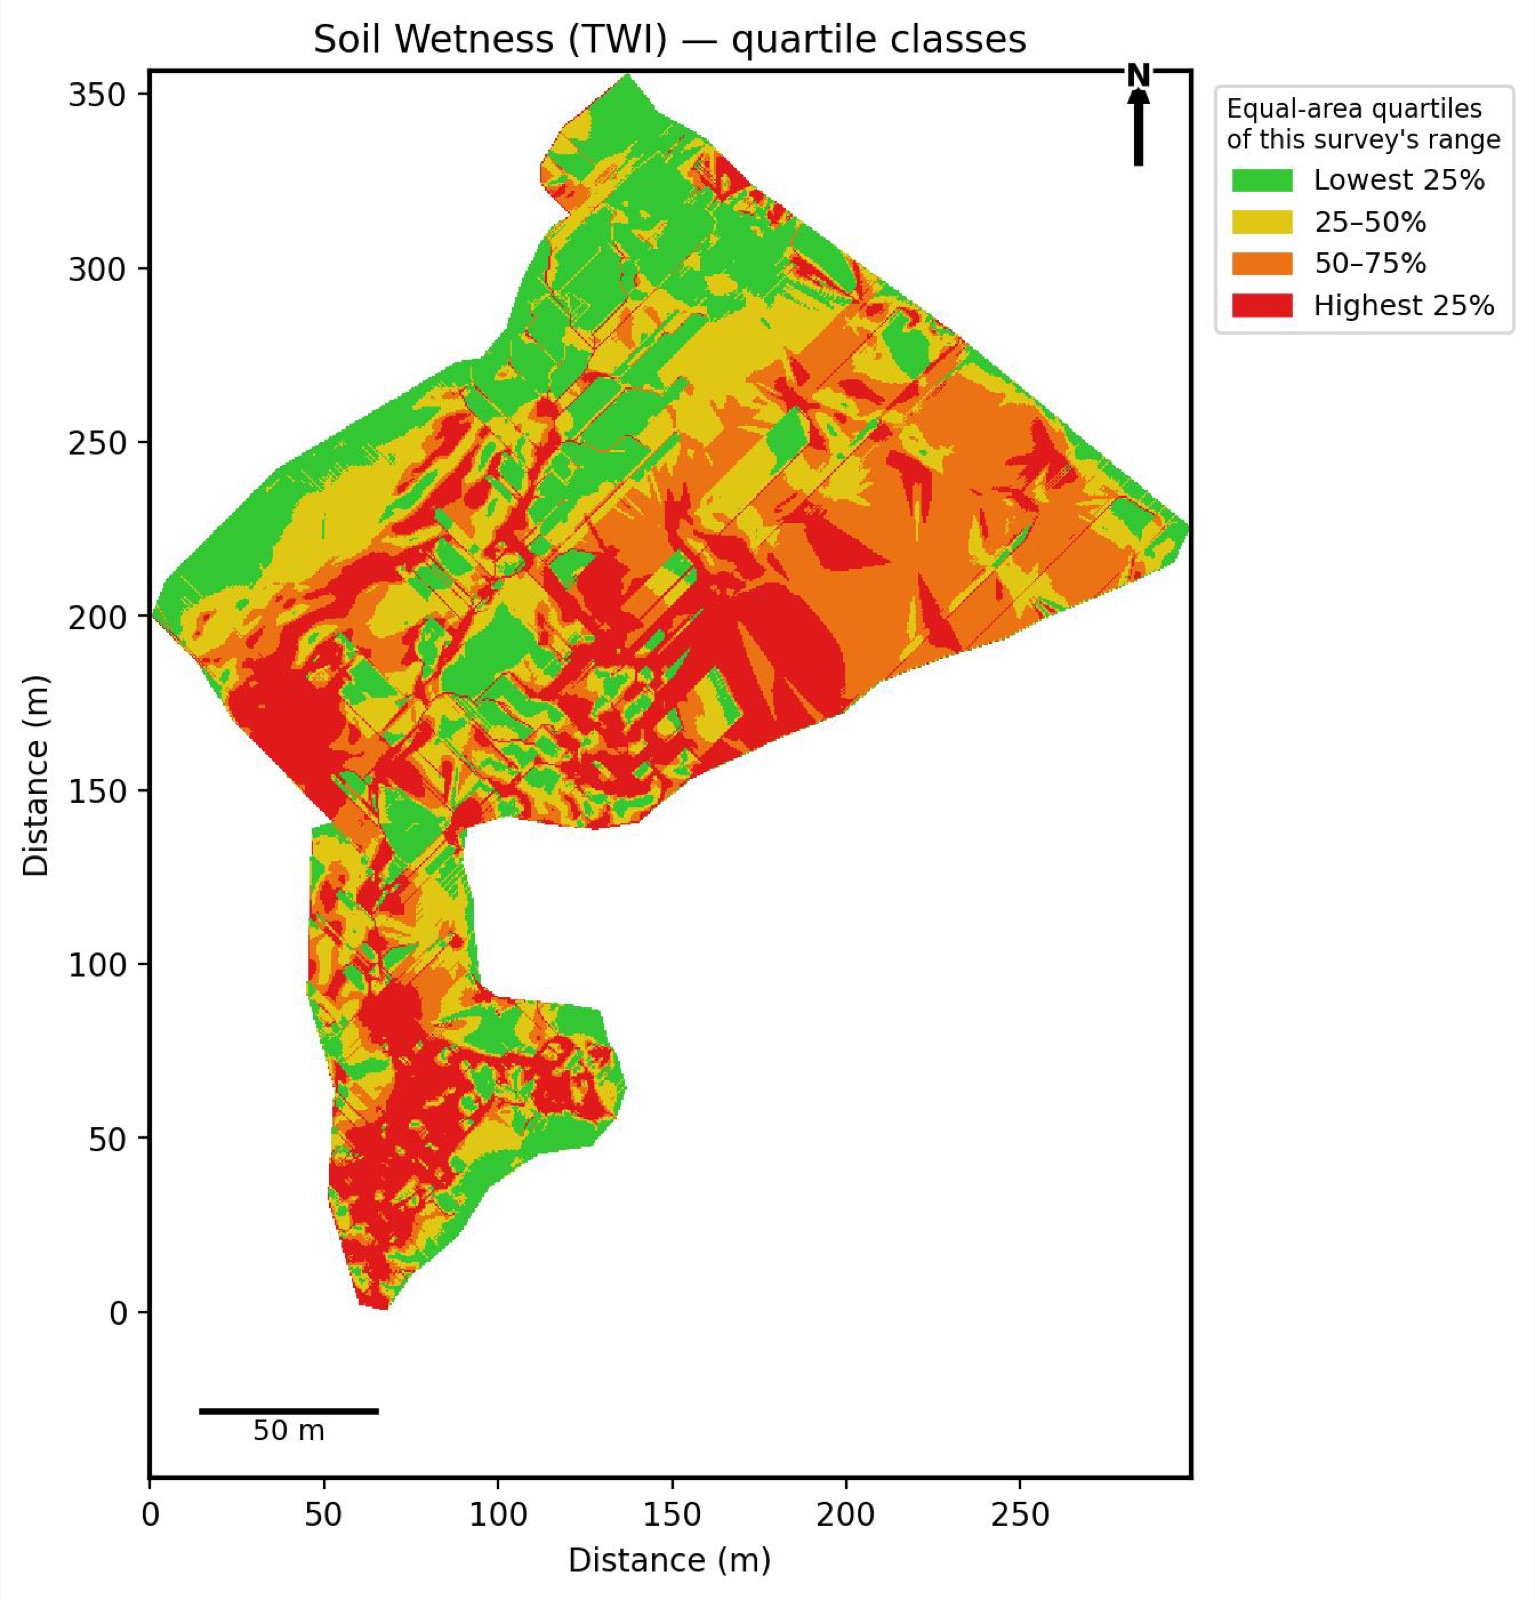
The Topographic Wetness Index estimates where water is likely to accumulate, based purely on terrain shape — no soil sensors required. Low-lying, gently sloped areas with large upstream catchments show up as consistently wetter. This flags zones prone to waterlogging during monsoon and, just as usefully, zones that hold moisture longest during dry spells.
Erosion Pattern
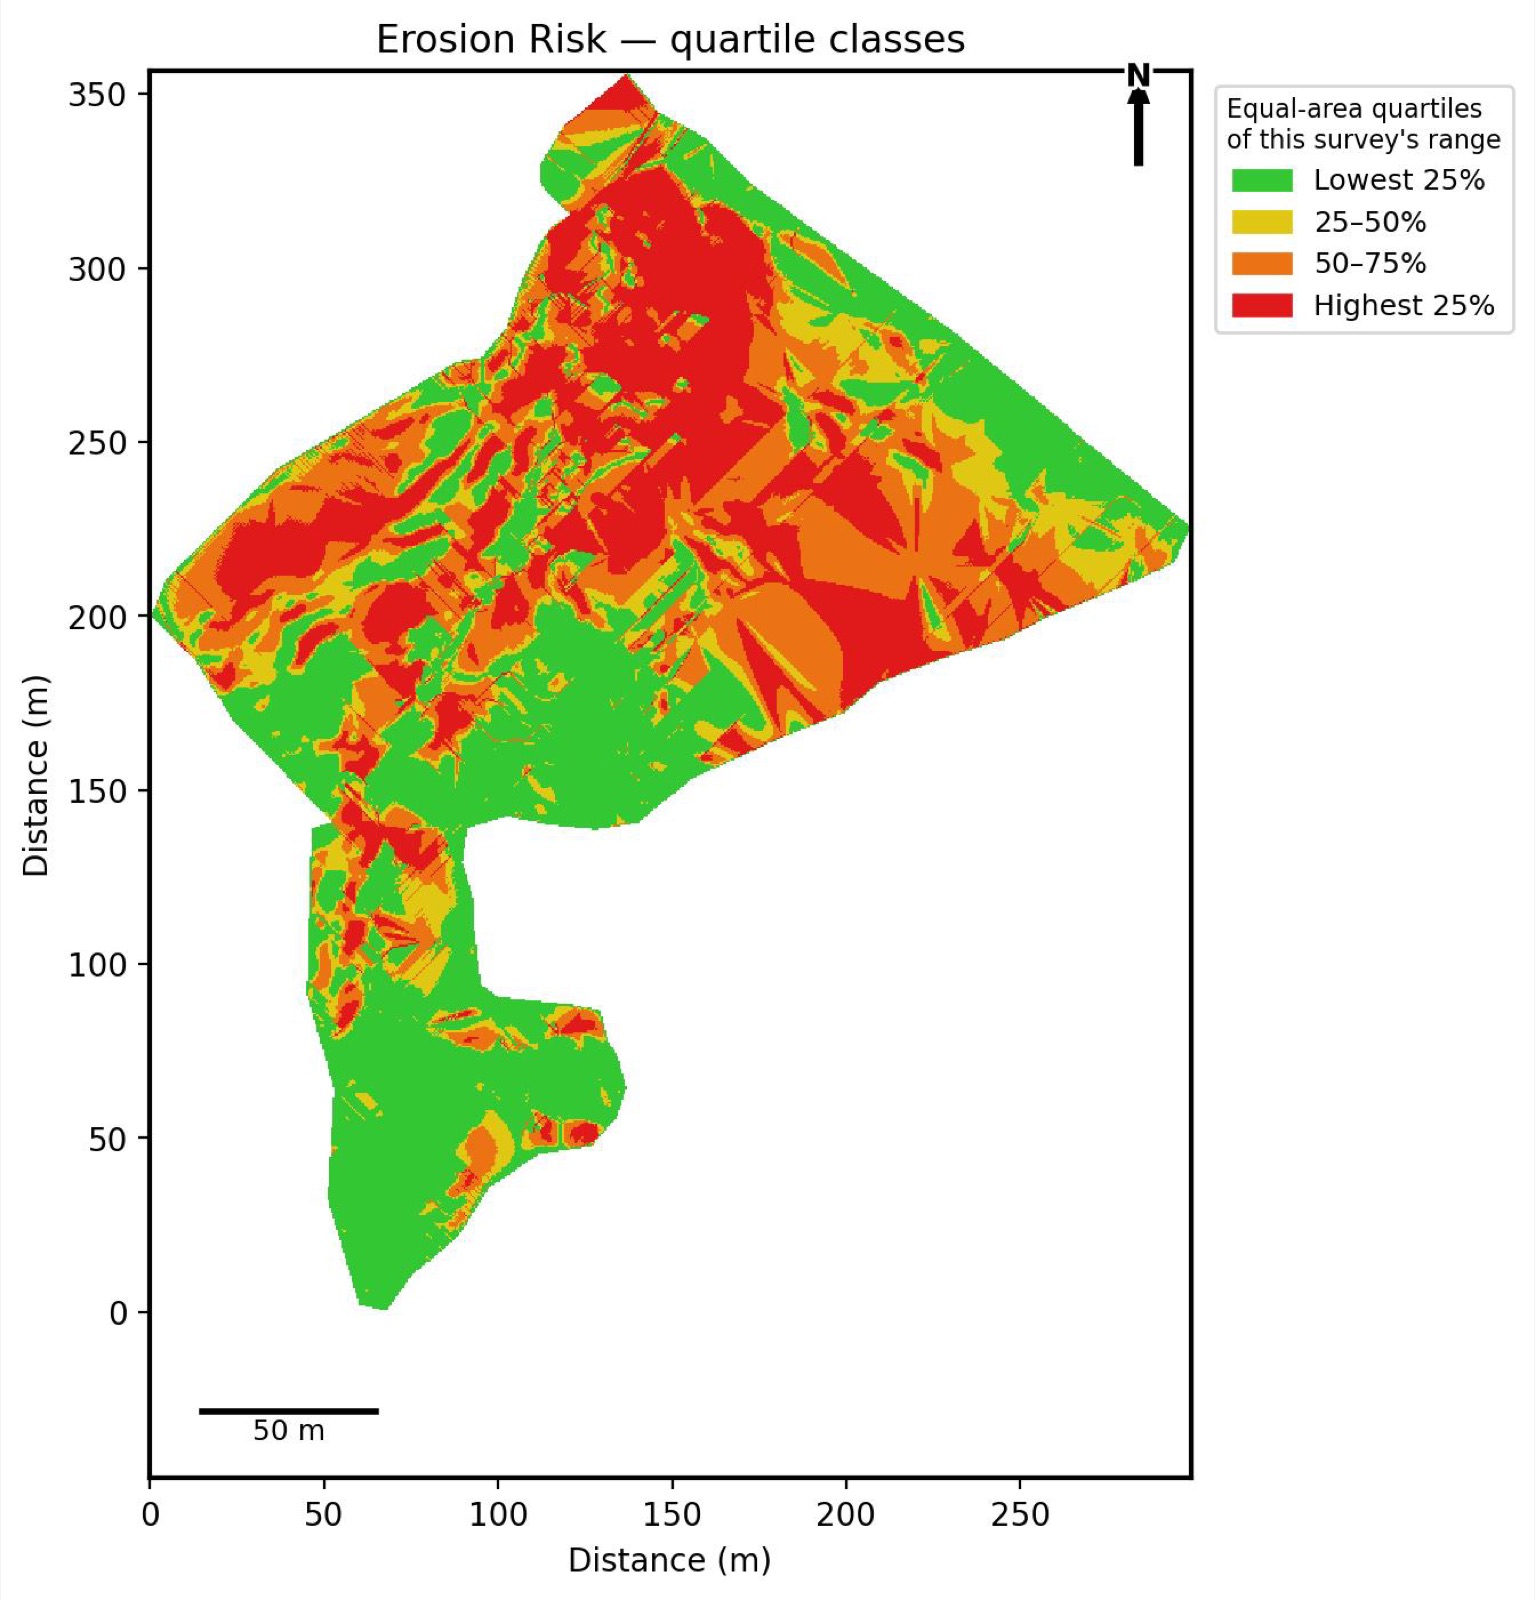
Combining slope, flow accumulation, and terrain roughness identifies where soil is most likely to wash away under monsoon rainfall. On coffee and mixed plantation estates, this maps directly onto where check-dams, contour bunding, or vetiver planting will do the most good — before a gully forms, not after.
Sun Exposure
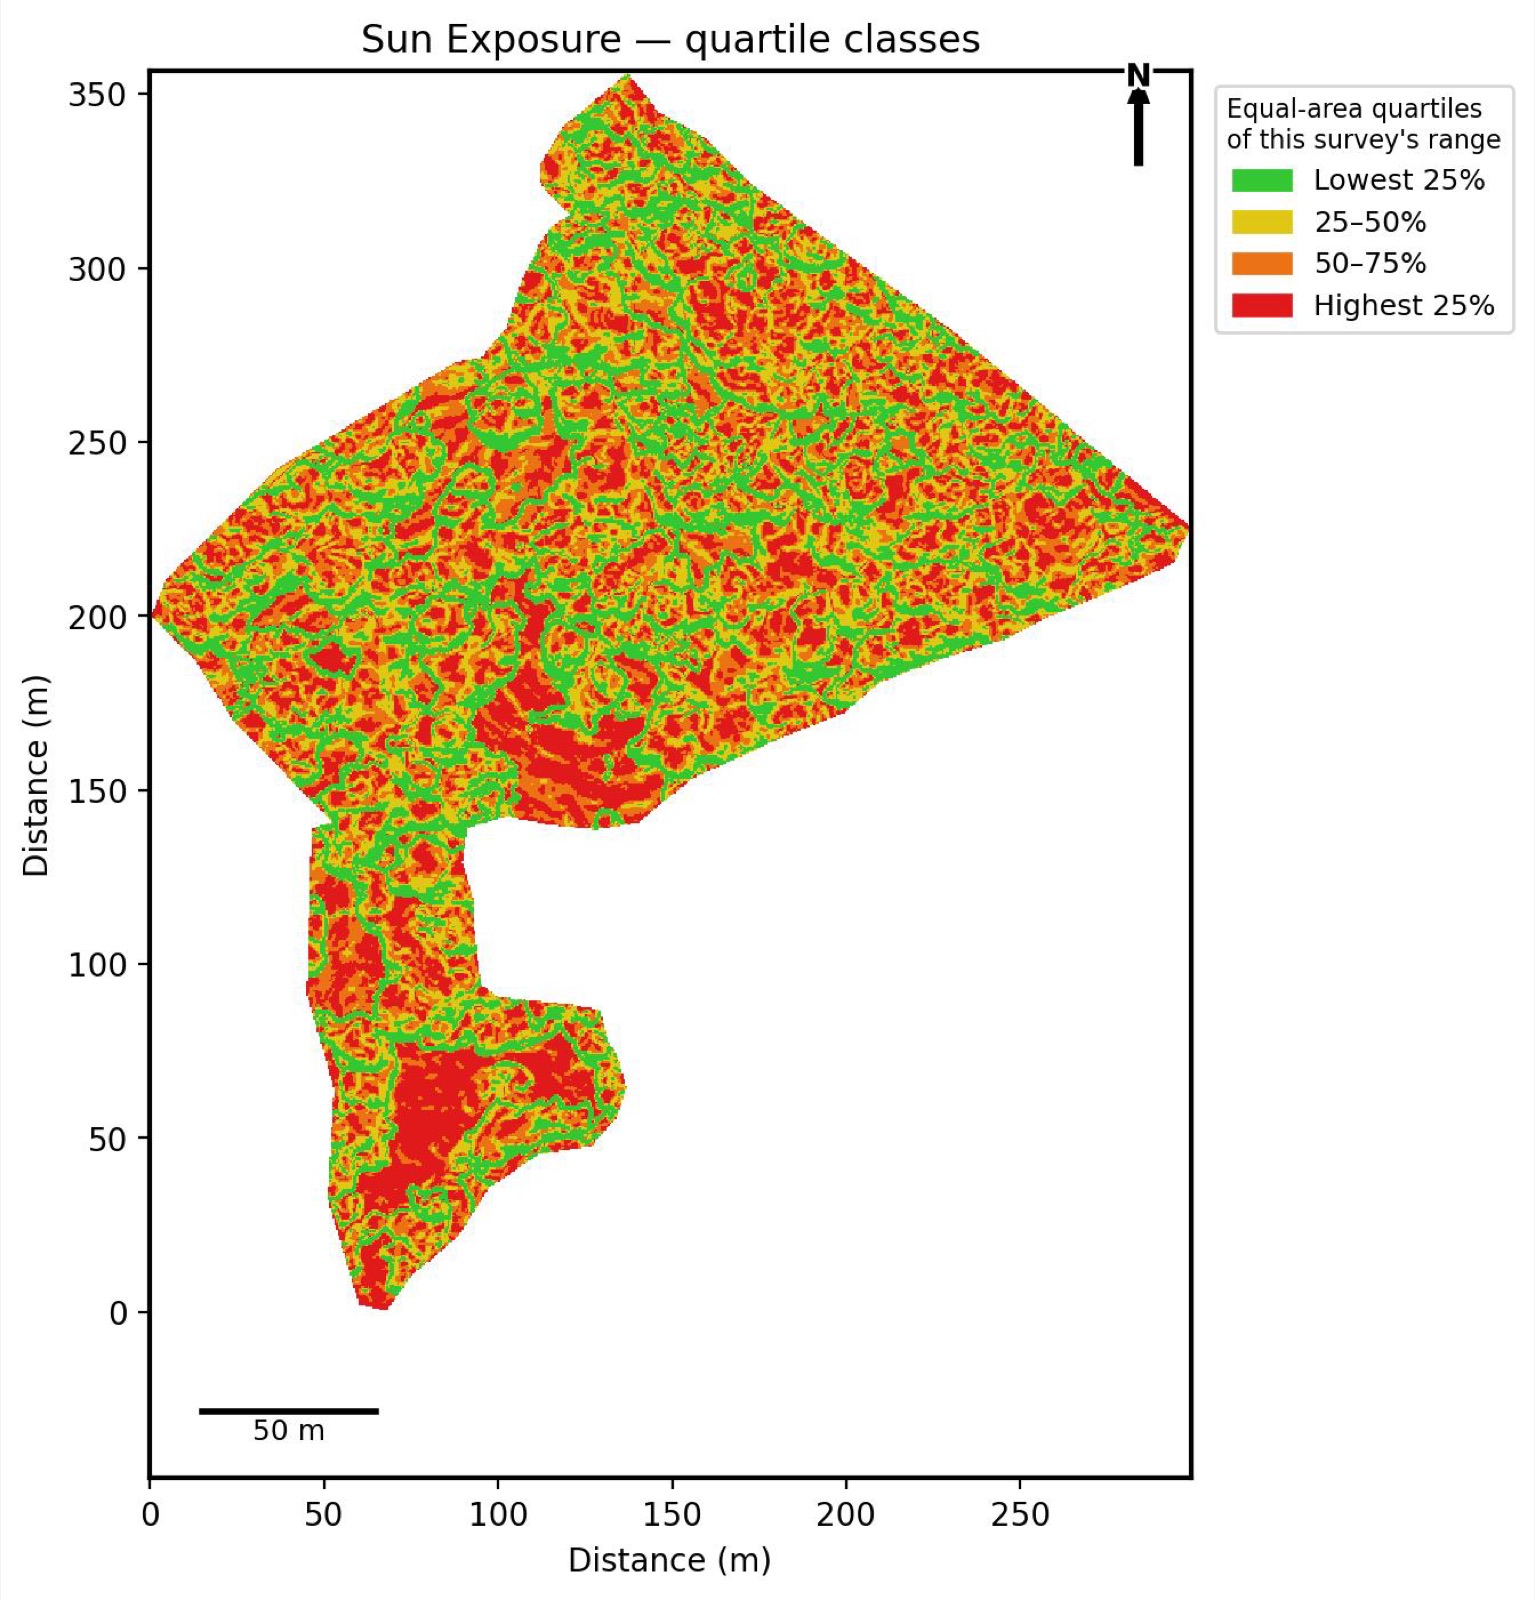
Terrain aspect and slope together determine how much direct sun a given patch of ground receives across the day and across seasons — a north-facing slope in a valley behaves very differently from an open, south-facing ridge. This is one of the direct inputs into crop siting analysis: matching what’s already growing, or what should be planted, against how much light a zone actually gets.
One Survey, Five Layers, One Decision Framework
None of these layers require a separate flight or a separate site visit — they’re all derived from the same DTM and DSM produced by a standard survey. Together they turn “the estate looks fine from the road” into a zone-by-zone map of where to act first.
See the full breakdown on our GIS Analytics & Precision Agronomy service page, or get in touch to discuss what these layers would show on your own estate.