

Every Future Thota survey starts the same way: a precision drone flight with RTK GPS positioning, processed through photogrammetry into three core outputs. On their own, the terms “orthomosaic,” “DTM,” and “DSM” don’t mean much to most estate owners. Side by side, with a real example, they’re straightforward.
The Orthomosaic — What the Land Actually Looks Like
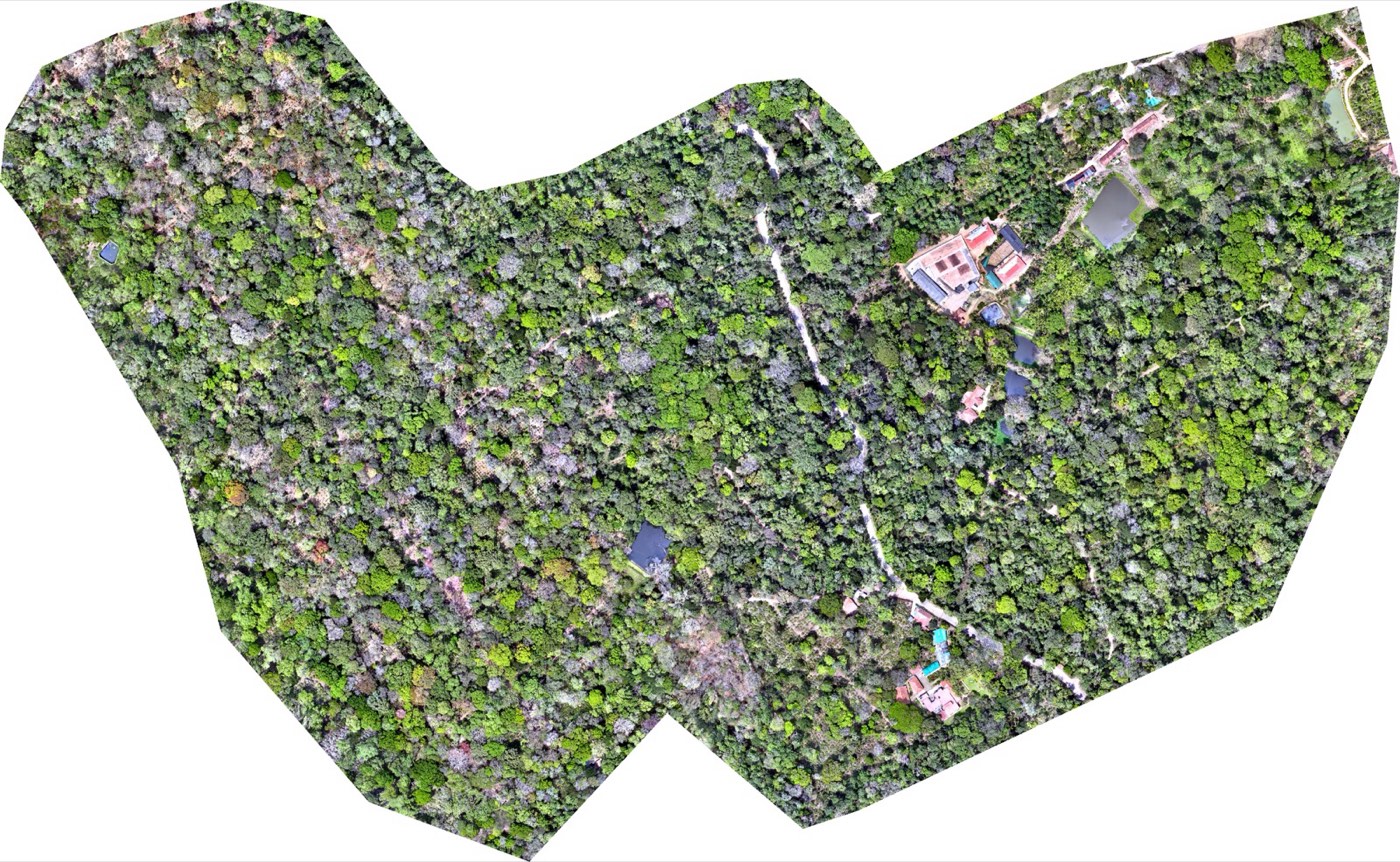
The orthomosaic is the aerial photograph most people expect from a drone survey — except it isn’t one photo. It’s hundreds of overlapping images, stitched and corrected for lens distortion and perspective so that every point on the map sits at its true geographic location. The result is comparable to Google Earth imagery of your own estate, but at up to 3 cm/pixel resolution — roughly ten times the detail.
Estate owners use the orthomosaic for boundary inspection, canopy overview, and simply documenting the property at a point in time. It’s also the base layer every other output is built on top of.
The Digital Terrain Model (DTM) — The Land Without the Trees
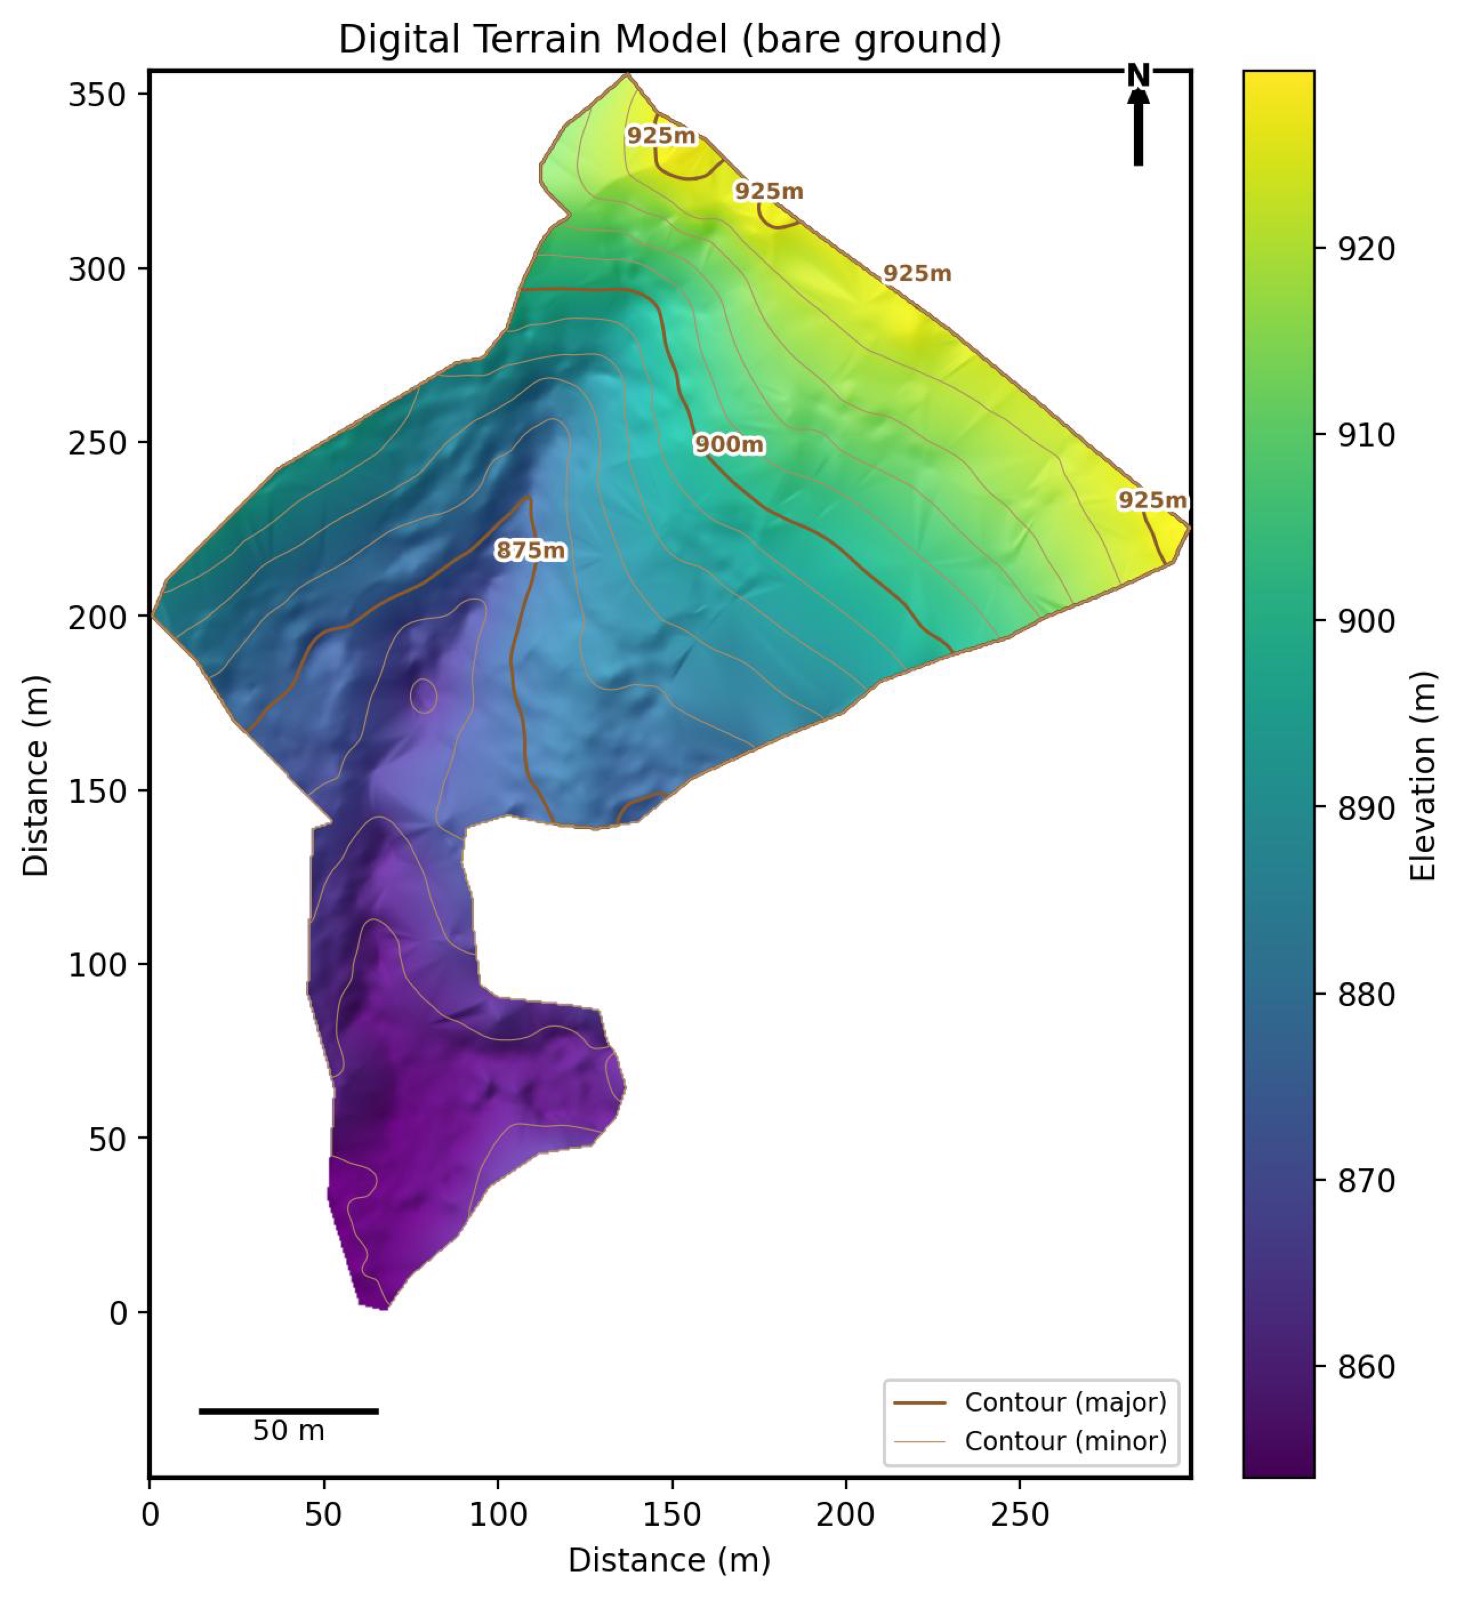
The DTM strips away canopy, buildings, and vegetation computationally, leaving only the bare-earth surface. On flat ground this wouldn’t matter much. On the sloped, undulating terrain typical of coffee and plantation estates, it matters a great deal — a 10-acre estate on a 20-degree slope can have up to 6% more actual surface area than a flat measurement suggests.
The DTM is what makes slope-corrected area calculations possible, and it’s the layer that feeds drainage planning, run-off pit placement, and every terrain-derived analytical layer covered in our GIS analytics breakdown.
The Digital Surface Model (DSM) — The Land With Everything Still On It
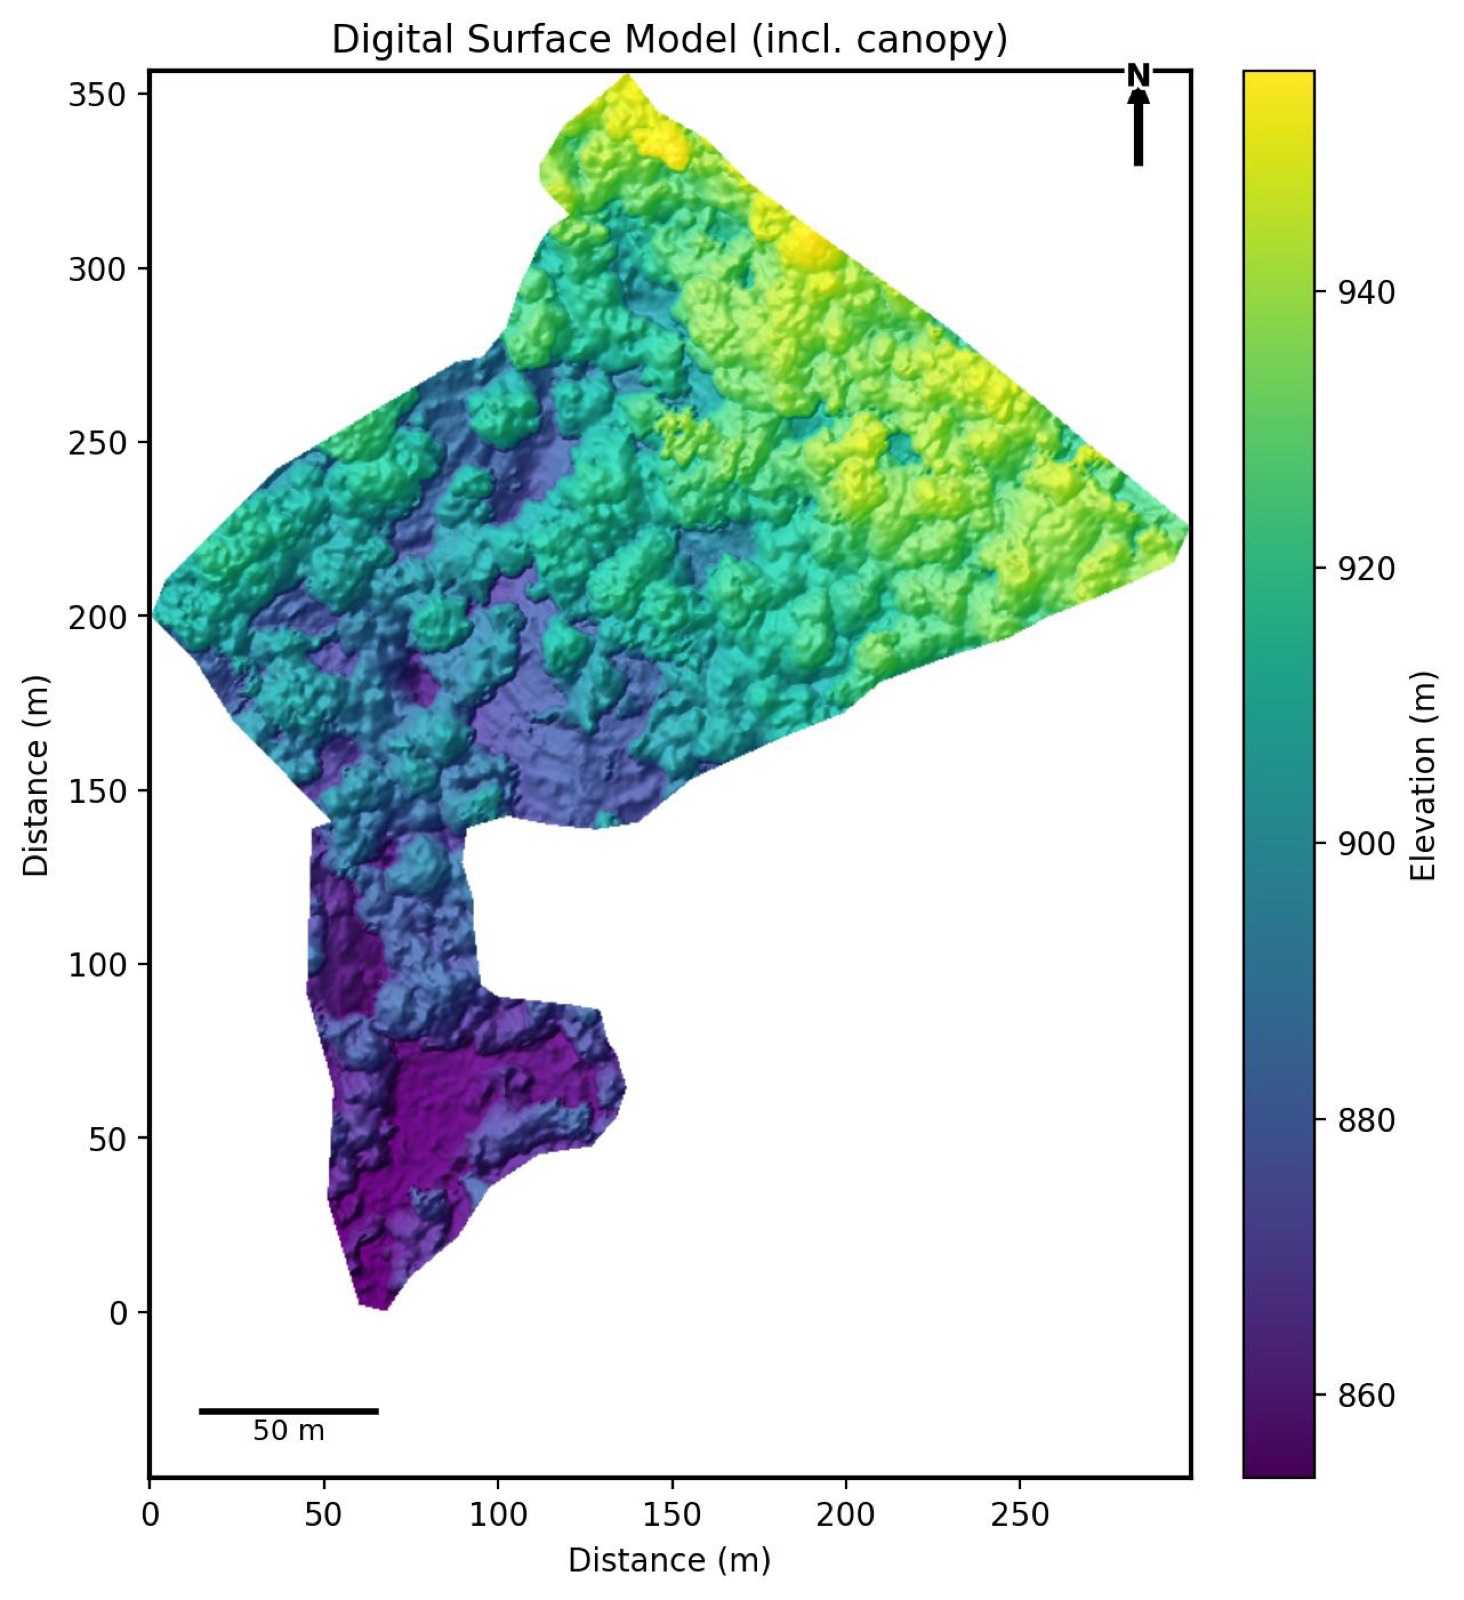
Where the DTM removes the canopy, the DSM keeps it. Subtract one from the other, pixel by pixel, and you get canopy height — individual tree heights, shade coverage, and structure heights, all without a single measurement taken on foot. This is the layer behind our canopy height model and shade-management analysis.
Seeing It in 3D
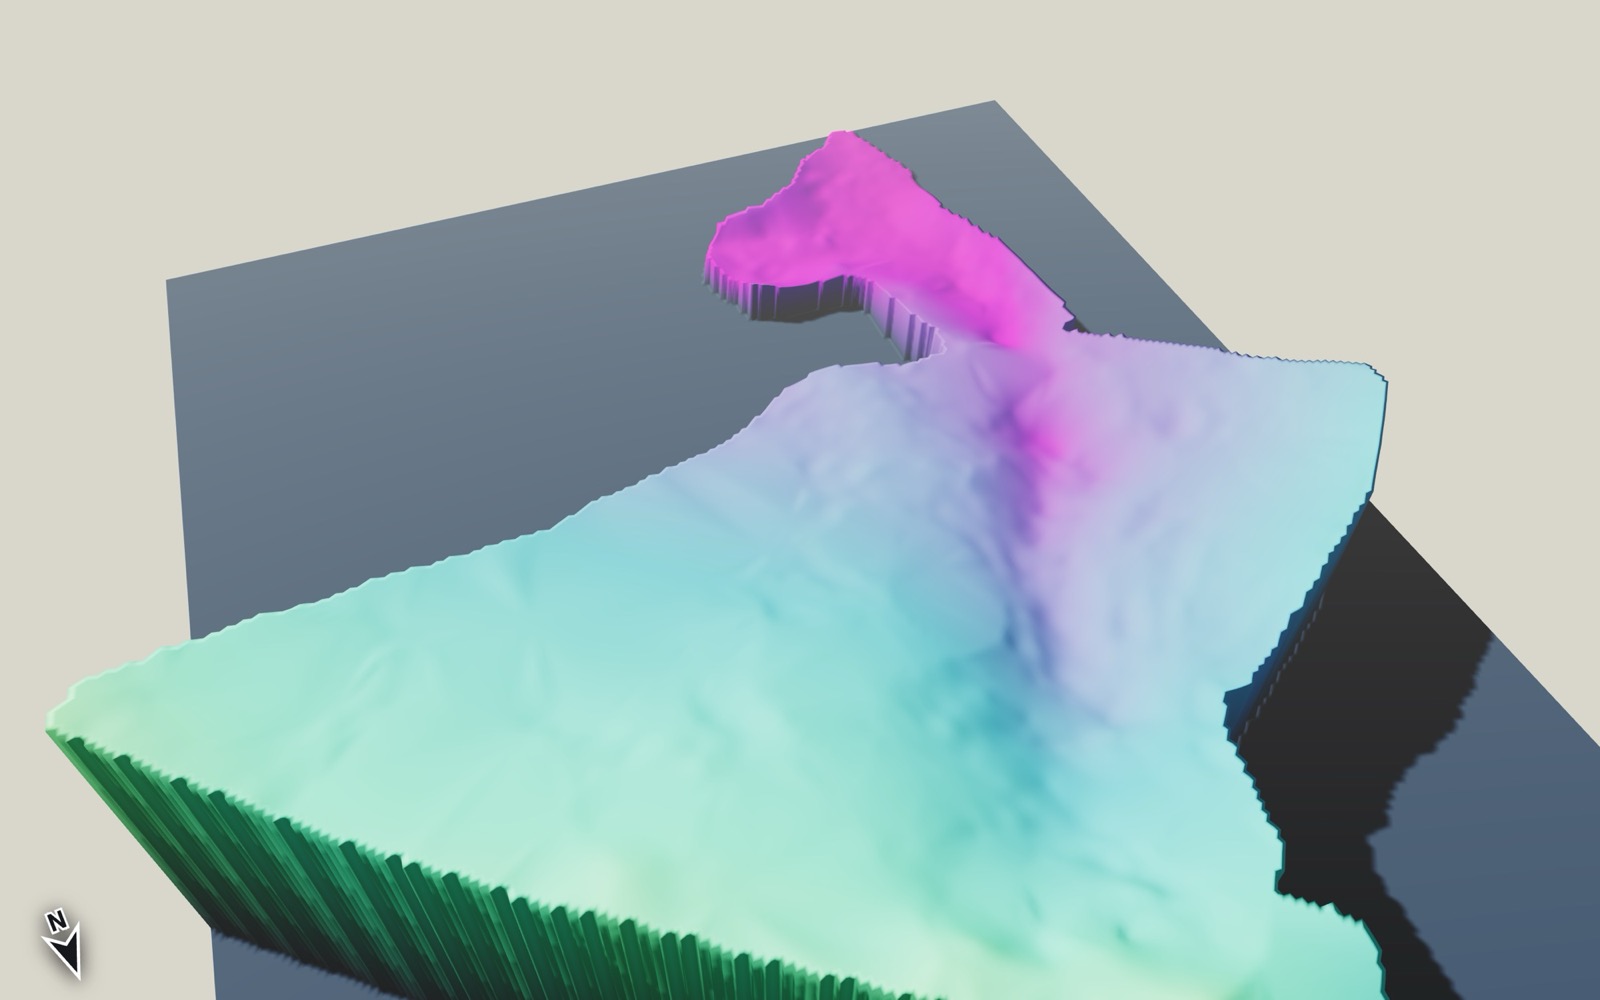
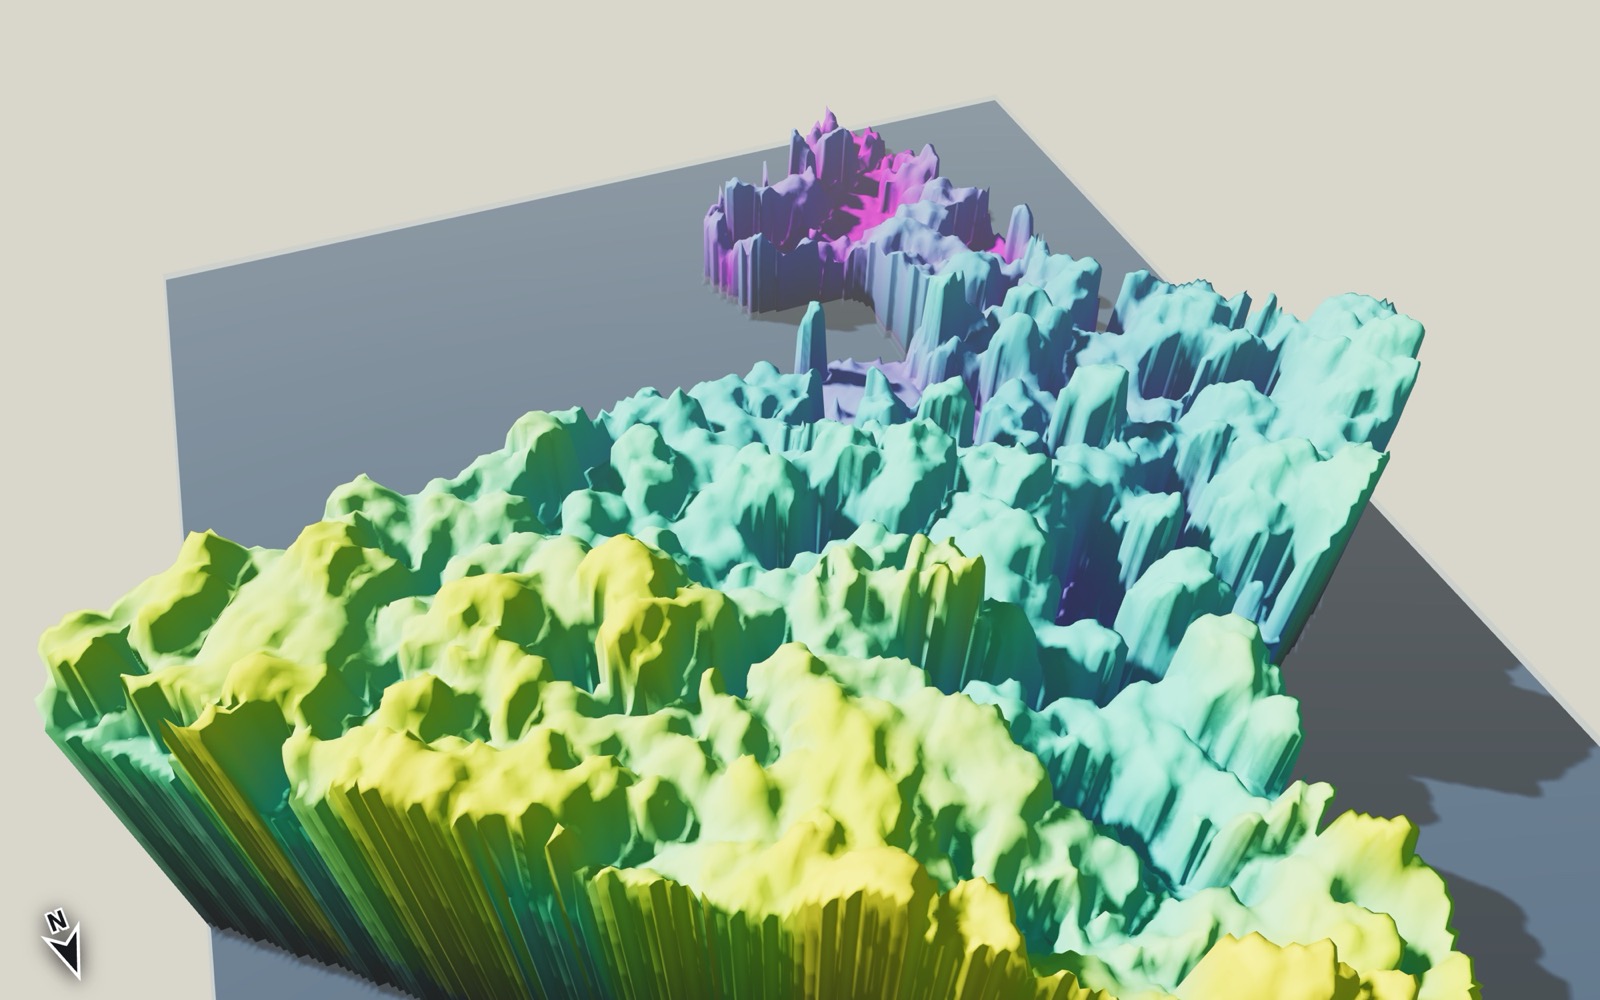
The topdown views above are what actually get measured and analysed, but they can be hard to read intuitively. Both the DTM and DSM can also be rendered as navigable 3D obliques — genuinely useful for client presentations and internal planning discussions, where “here’s the slope on the eastern boundary” lands very differently as a rotatable 3D surface than as a flat colour map.
Why All Three, Not Just One
A single orthomosaic tells you what the estate looks like. Add the DTM and you know the true shape of the land. Add the DSM and you know what’s growing on it, and how tall. Together, they’re the foundation every other deliverable — vegetation health maps, crop siting zones, individual tree detection, even pond and lake volume surveys — is built from.
All three, along with a boundary file and a summary PDF report, are included in a standard survey — see the full deliverables list for exact formats and specs. Every output is generated within 5 business days of the flight.
Ready to see what a survey of your own estate would look like? Request a quote, or read more about our drone mapping service.