

After extracting tree heights and NDVI values across an estate, you often want to compare how different species or varieties are distributed. Are mango trees taller on average than coconut? Is NDVI higher in one block versus another? This script generates the comparison charts automatically.
What it does
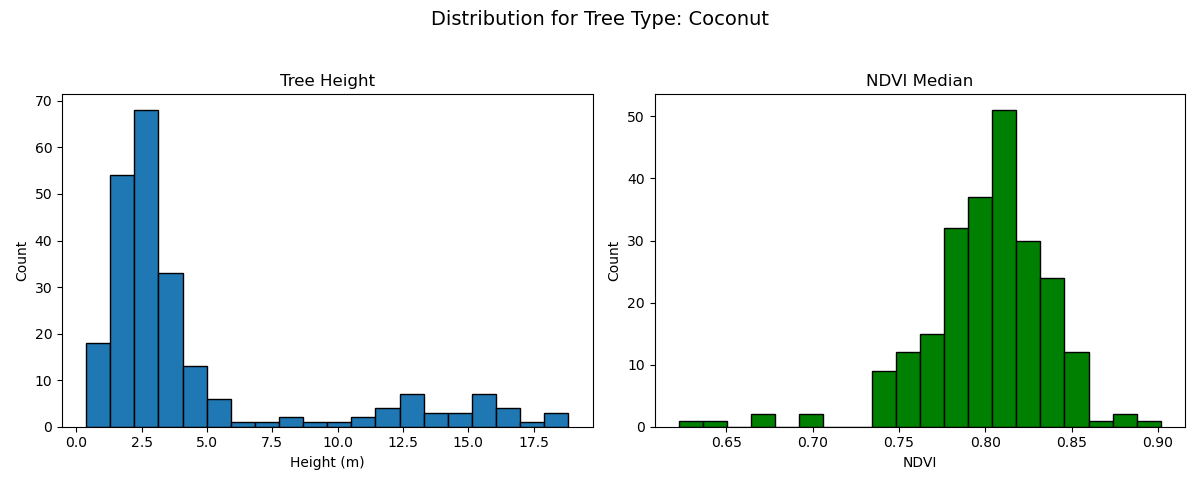
The plot_tree_attributes_histograms.py script reads height and NDVI_median values from a polygon layer, groups them by the tree_type field, and plots two side-by-side histograms for each group:
- Left: height distribution (in metres)
- Right: NDVI_median distribution
Each chart is displayed on screen as a pop-up and saved as a PNG alongside the source file.
Here’s the real output from a coconut plantation survey — the last step in a complete per-tree health workflow that also covers buffering, height extraction, canopy masking, and NDVI sampling:
What you need
- QGIS 3.28 or newer
matplotlib(may need install via OSGeo4W Shell — see below)- An active polygon layer with these fields:
height— numeric tree height in metres (generated bytree_heights_from_dsm_dtm.py)NDVI_median— numeric NDVI value (generated bycanopy_ndvi_median_calc.py)tree_type— string field used for grouping
- The
plot_tree_attributes_histograms.pyscript from the Drone Mapping, Terrain & Multispectral Analysis QGIS Package
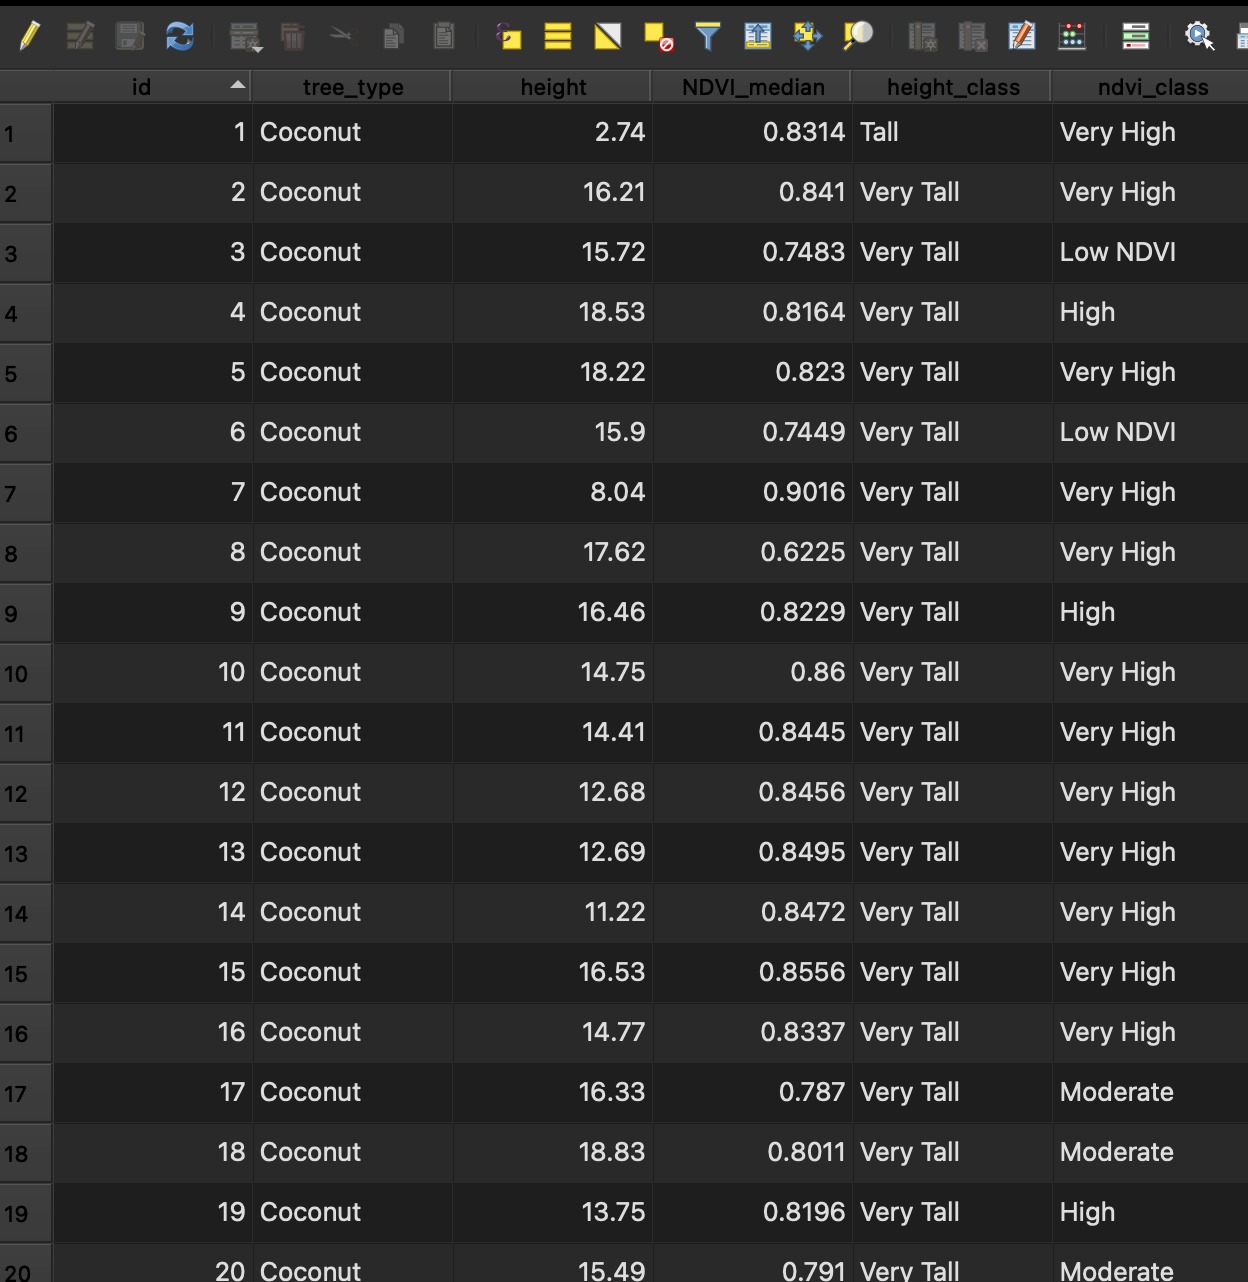
Here’s what that looks like in the attribute table before running this script — height and NDVI_median already populated per tree, tree_type set to “Coconut”:
Steps
- Load your polygon layer (with
height,NDVI_median, andtree_typefields) and click it to make it the active layer. - Open Plugins → Python Console → Show Editor.
- Paste the script and click Run.
One PNG per tree_type value is saved in the same directory as the active layer. The charts are also shown on screen during the run.
Installing matplotlib
If you get an import error for matplotlib, install it via the OSGeo4W Shell (Windows):
pip install matplotlib
On macOS/Linux, use the QGIS Python environment or install via the terminal with the appropriate Python interpreter.
Preparing the data
This script is designed to be run after:
- generate_canopy_mask.py — creates the canopy mask
- canopy_ndvi_median_calc.py — adds
NDVI_medianto each polygon - tree_heights_from_dsm_dtm.py — adds
heightto each polygon
If your tree polygons started as digitized points, buffer_active_layer.py is the step before that turns each point into a crown-sized polygon in the first place.
The tree_type field is expected to already be in your dataset (from field annotation or survey data).
Get the script
plot_tree_attributes_histograms.py is part of the Drone Mapping, Terrain & Multispectral Analysis QGIS Package — all 16 QGIS automation scripts at $99 USD.