

A raw DTM or DSM raster, styled with QGIS’s default single-band grey renderer, looks like flat noise — no depth, no readable terrain. The moment you add hillshade shading and a colour ramp, the same file becomes something a client can actually look at and understand. It’s the base layer behind almost every other image in this QGIS script series — the DSM/DTM hillshade pairs you’ve seen in the CHM, contour, lake volume, and tree height posts are all generated by this one script.
What it does
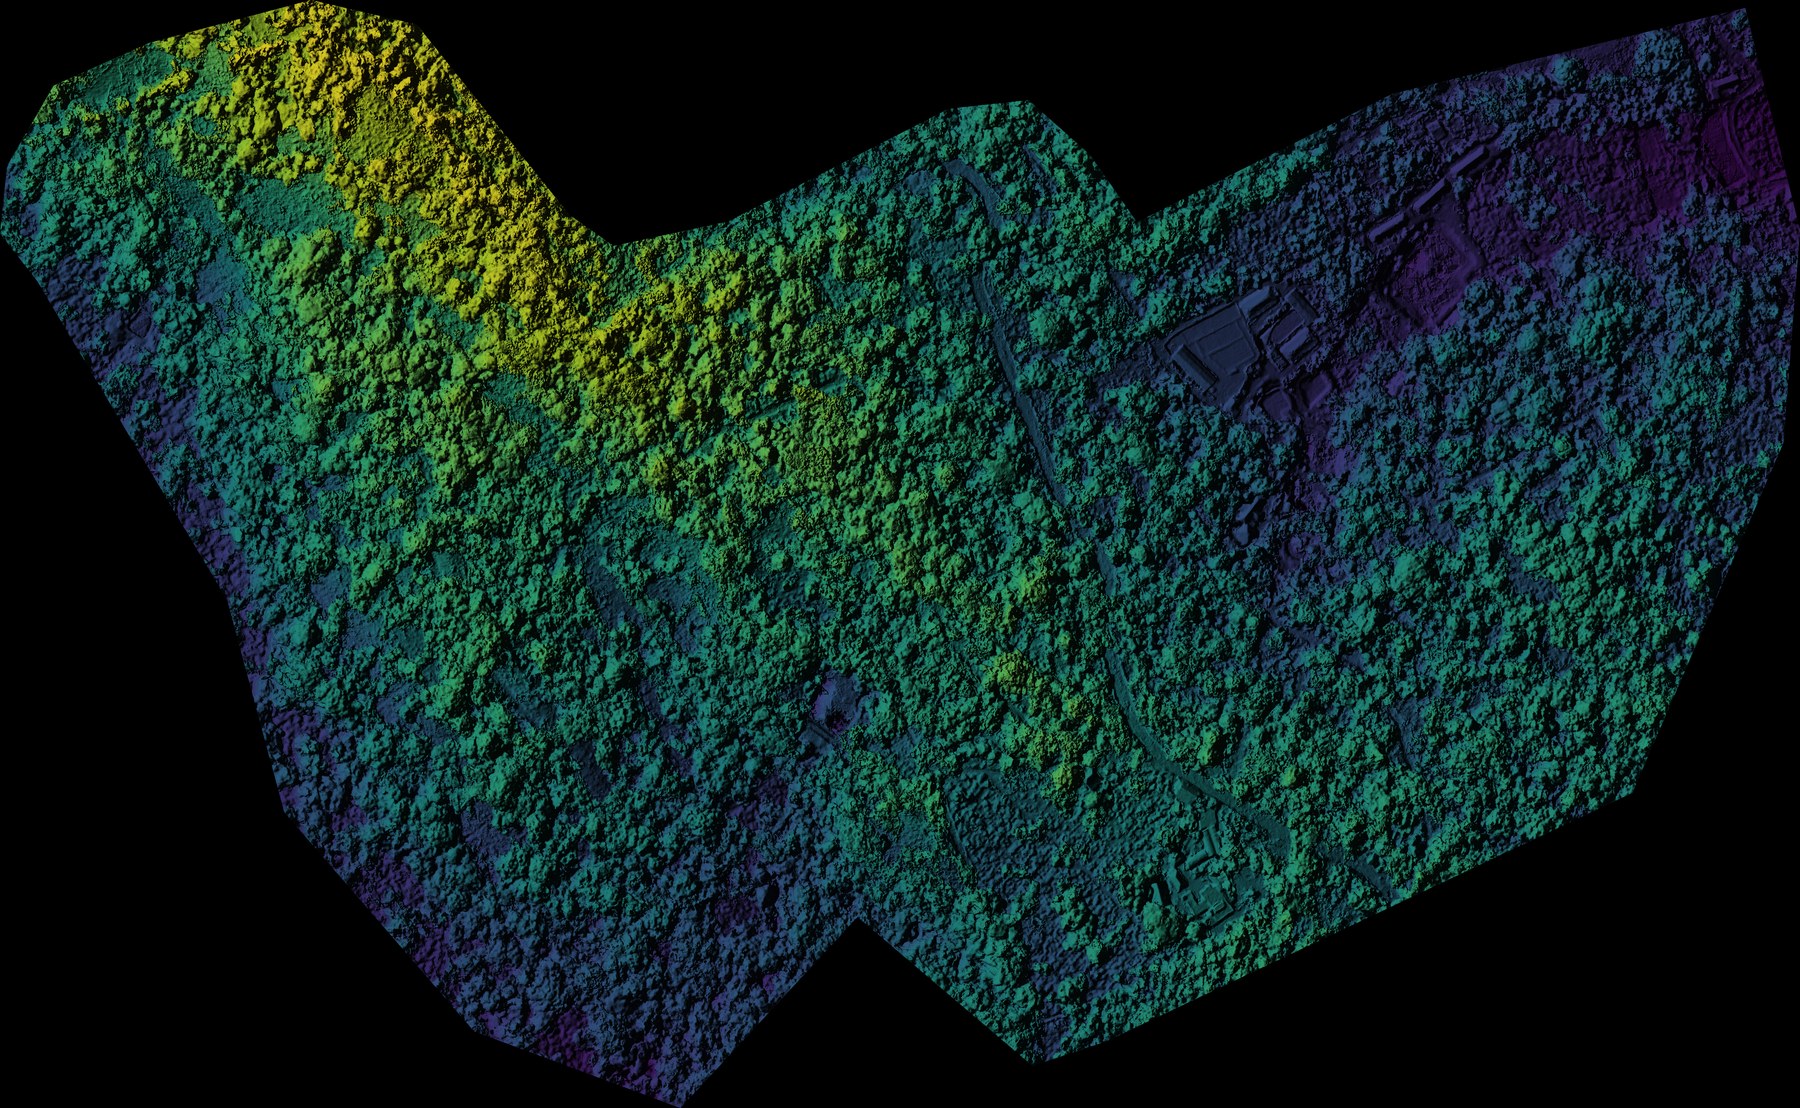
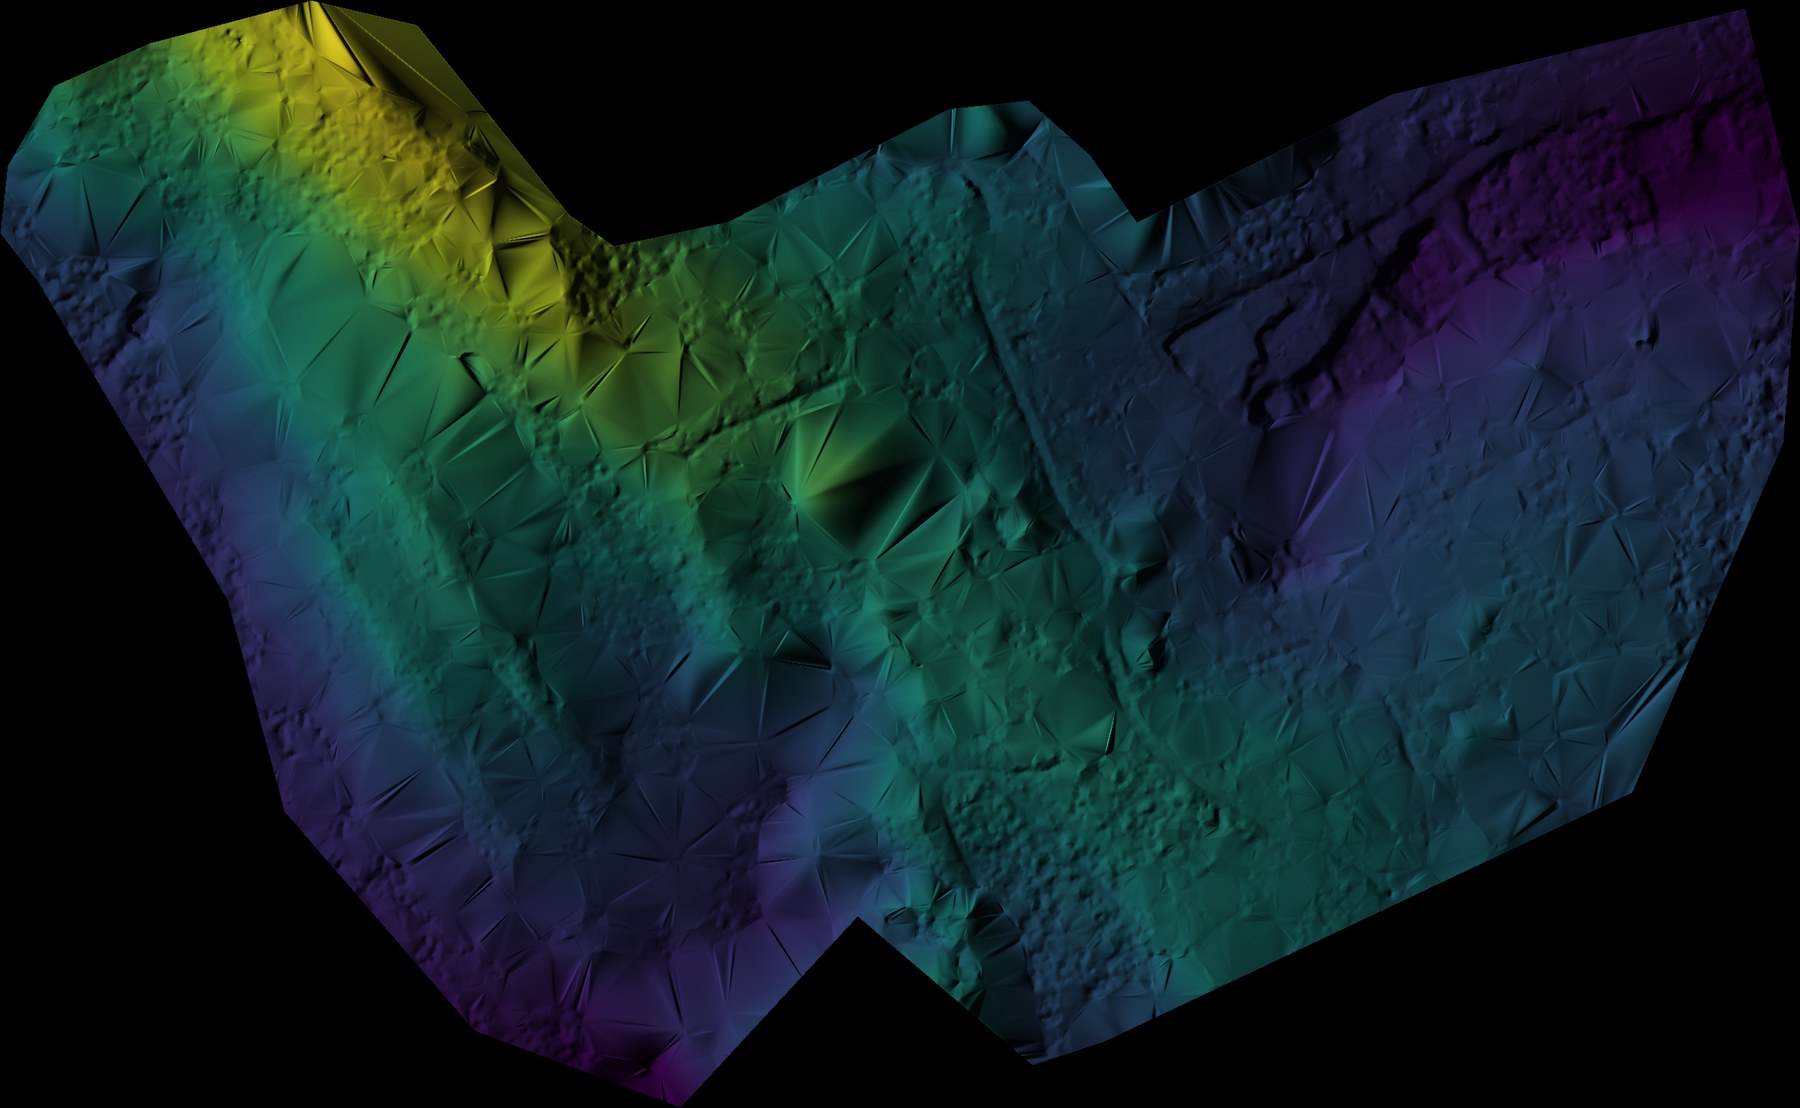
The generate_hillshade.py script reads your DTM or DSM directly with GDAL, generates a multidirectional hillshade (light averaged from multiple azimuths so there are no blind, shadow-flattened valleys), and applies a viridis colour ramp — purple → blue → teal → green → yellow, the same palette WebODM uses — blended pixel-by-pixel with the shading. Working at the pixel level with numpy sidesteps QGIS’s own raster renderer entirely, which is what makes the output consistent regardless of the source raster’s own styling.
Two behaviours worth knowing about:
- Auto-downsampling. Rasters over 50 MB are scaled down before processing so a large drone-derived DTM/DSM doesn’t hang QGIS. The threshold is configurable.
- Adaptive colour normalisation. Terrain with a large elevation range (a ridge-and-valley estate, say) is normalised with straight min/max. Terrain with a small range — a flat plot, or a pond site where most of the file is near-level ground — is normalised with 2nd–98th percentile instead, so the full colour palette still spreads across the subtle variation rather than collapsing to one or two colours.
Output: {name}_hillshade_colour.tif — an RGBA GeoTIFF with the colour hillshade in the RGB bands and nodata pixels made transparent via the alpha band — plus a companion .jpg for quick sharing. Both save next to the source raster and the GeoTIFF is added to your QGIS project automatically.
What you need
- QGIS 3.28 or newer (LTR recommended)
numpy+ GDAL — bundled with QGIS, no extra install- A DTM or DSM raster, checked (ticked) in the Layers panel — the layer name must contain
dtmordsmmatching whichever you setELEVATION_SOURCEto - The
generate_hillshade.pyscript from the Coloured Hillshade Generator product page, or the Drone Mapping, Terrain & Multispectral Analysis QGIS Package
DSM (surface elevation, canopy included) from a real coffee estate survey:
DTM (bare ground, canopy stripped out) — the same script, same file, run against the DTM instead:
Steps
- Load your DTM or DSM raster into QGIS.
- Check (tick) the layer visible in the Layers panel.
- Open Plugins → Python Console → Show Editor.
- Paste the script. Set
ELEVATION_SOURCEto"dtm"or"dsm"depending on which you loaded. - Click Run. The coloured hillshade GeoTIFF and JPEG are generated and the GeoTIFF is added to your project.
Configurable parameters
At the bottom of the file, the generate_hillshade() call takes three lighting parameters:
z_factor— vertical exaggeration. Raise this on very flat terrain to make subtle relief more visible.azimuth— light direction in degrees (default315, northwest).altitude— sun angle above the horizon (default35). Lower values throw longer shadows and give more contrast, at the cost of some detail in shadowed areas.
ELEVATION_SOURCE, DOWNSAMPLE_THRESHOLD_MB, and SMALL_RANGE_THRESHOLD_M are set near the top of the script.
Reading flat terrain
The percentile normalisation matters most on sites without much elevation range — a pond or lake basin is a good example, since most of the surrounding ground sits close to one elevation and only the excavated basin drops away:
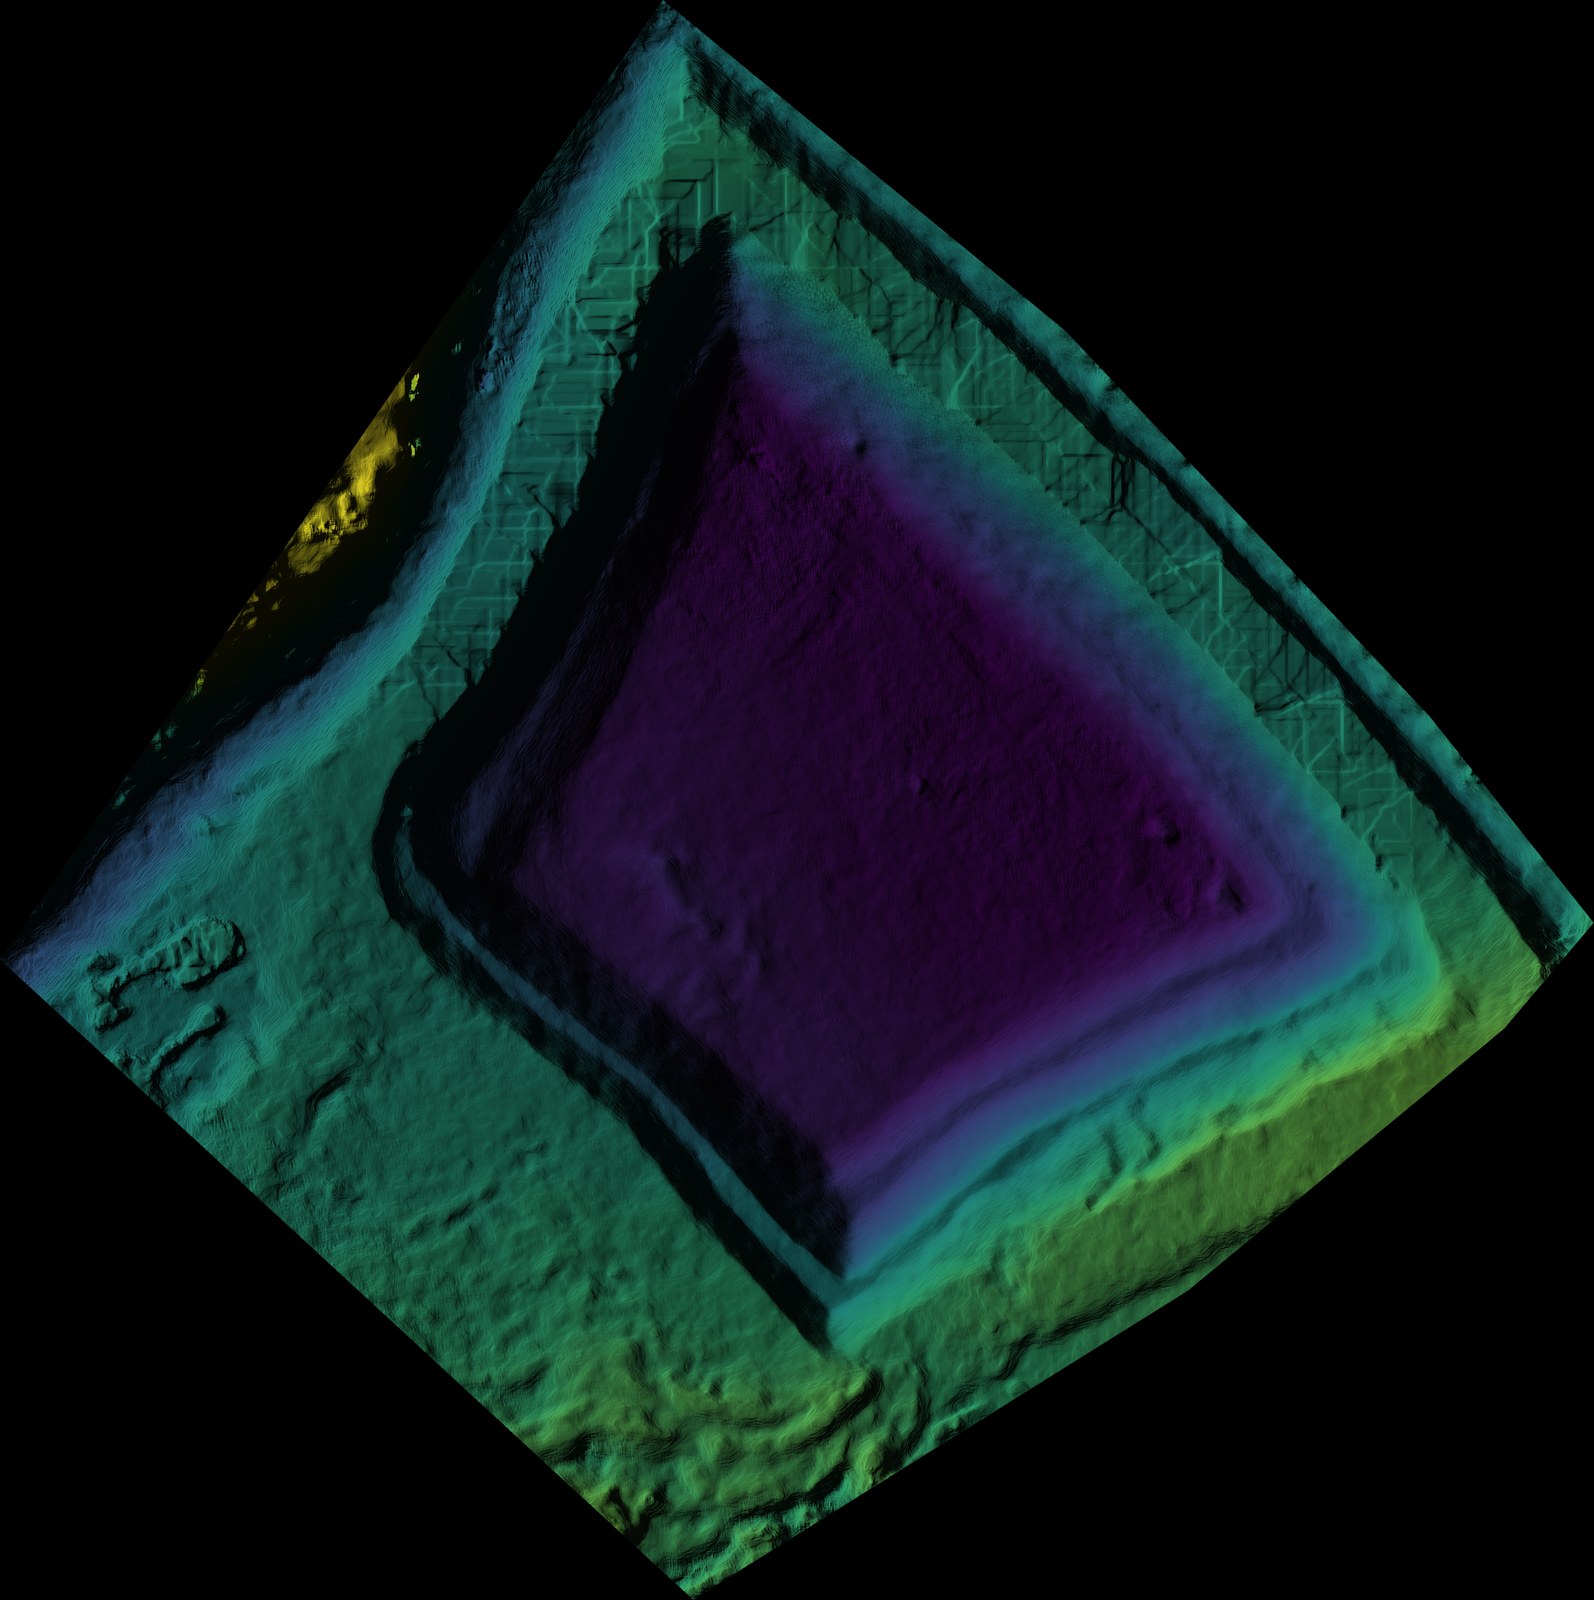
Without percentile stretching, a file like this would render almost entirely as one or two colours from the ramp. With it, the basin depth and the surrounding ground both stay visible.
Where this shows up elsewhere
Coloured hillshade generated by this script is the visual backdrop used throughout this series to show what a script’s source raster actually looks like: the ridge lines in Smooth Contour Generator, the excavated basin in Lake Volume Calculator, and the individual tree canopies in Tree Height Extractor and the full tree-health workflow are all this same script, run against different projects.
Get the script
generate_hillshade.py is available on its own from the Coloured Hillshade Generator product page for $20, or as part of the Drone Mapping, Terrain & Multispectral Analysis QGIS Package — all 16 QGIS automation scripts at $99 USD.