Drone Survey - altitude study
Introduction
Drones offer much more accurate land area surveys than traditional old methods. The accuracy comes from using extremely precise GPS mapping of land features, which may have errors of only a few centimetres (using RTK enabled systems). From this mapping, a digital terrain model (DTM) can be processed in software, which models the bare earth surface removing the trees and other man made surfaces like buildings. The DTM gives us the slope variations across the land surface, and we use this to obtain accurate surface area measurements. In this article we compare the land data collected at different drone flying altitudes, and discuss the various considerations. We conclude with our recommendations and best practices for accurate surveying.
At Future Thota, we specialise in using drones and precision technology for specialised agricultural data consultation like precise area measurements and other geospatial analytical solutions, to help you manage your property with data. The below example is a land survey of a coffee plantation in Coorg, in the Western Ghats of Southern India.
Digital Terrain Model (DTM)
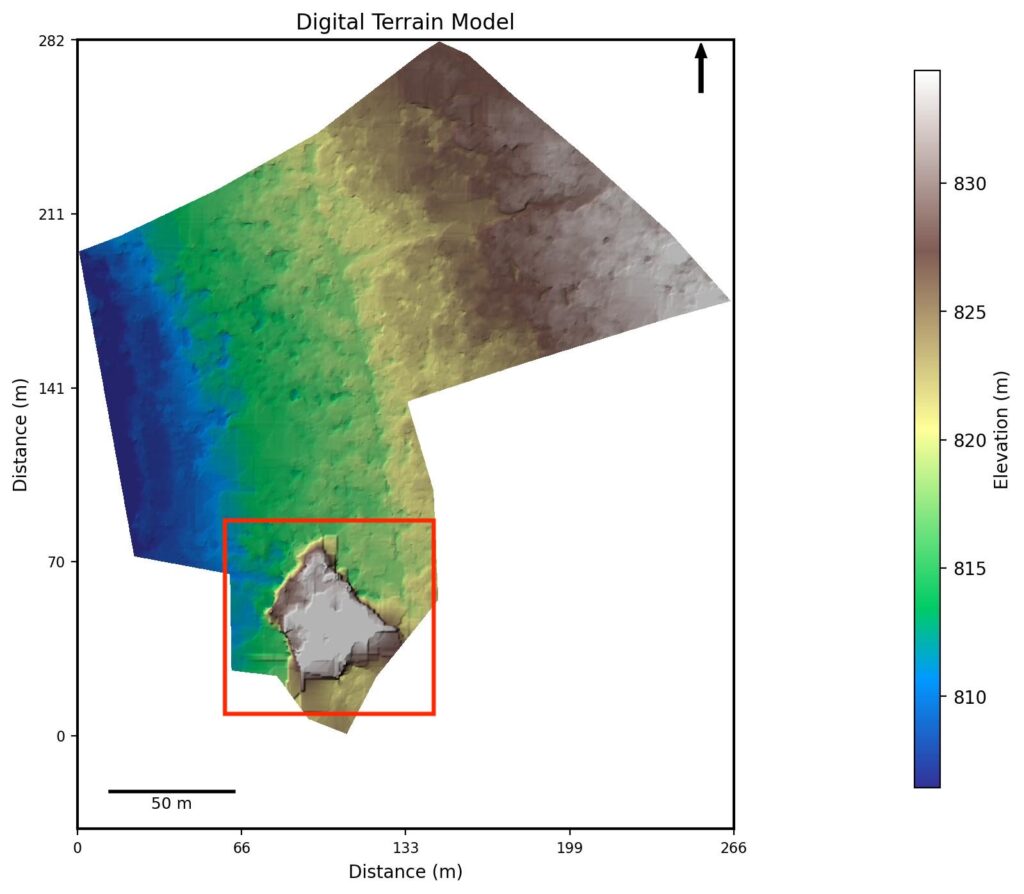
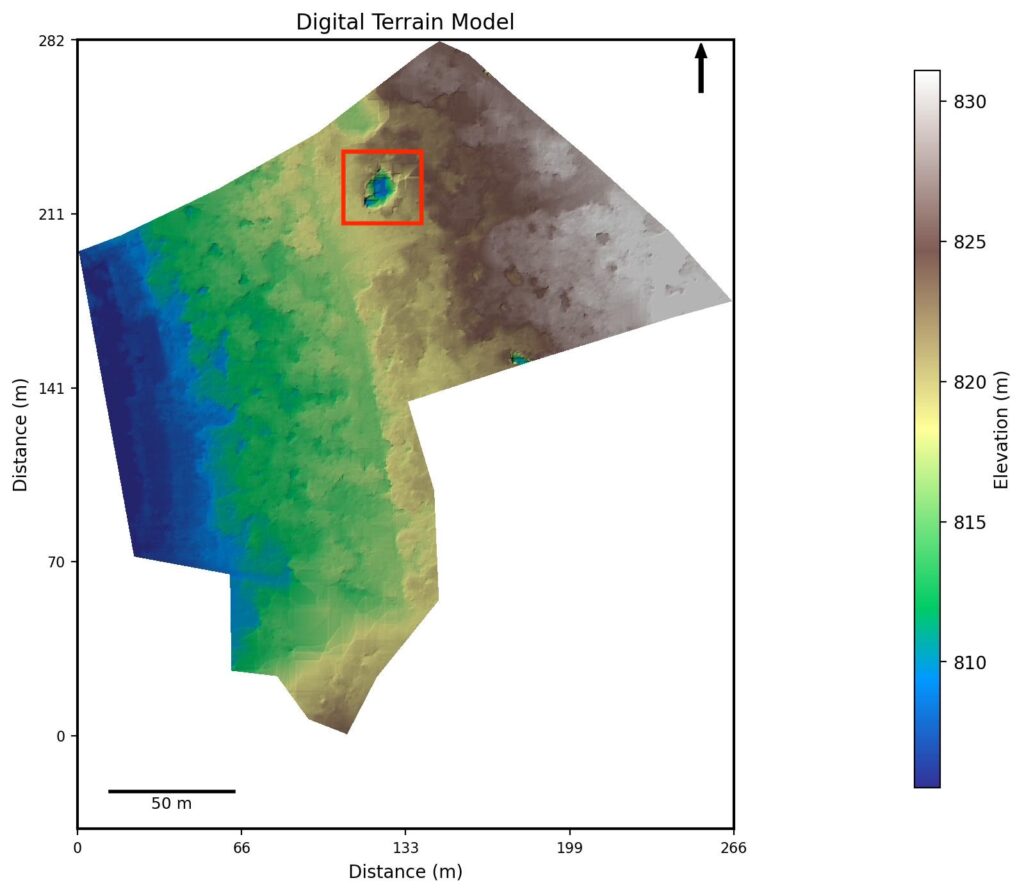
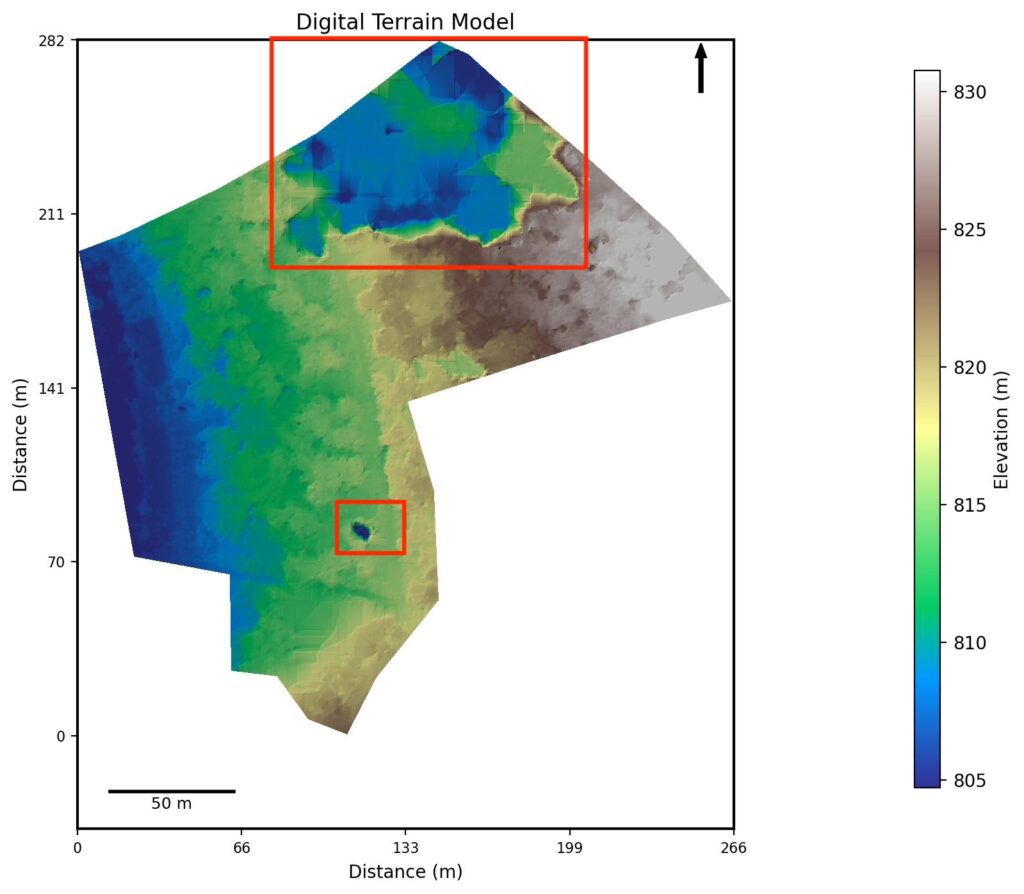
The drone was flown 3 times on the same day, at different fixed altitudes 150 ft, 200 ft, and 400ft. The overlap of photos in side and front of the automated mission were set to the default 70% and 80% values respectively.
We can observe the following in the DTM:
- Unusual ‘craters’ or ‘plateaus’, highlighted in the red boxes. These anomalies are evident by comparing the different flights as they exist only at certain altitudes.
- The anomalous ‘craters’ introduce altitude dips whereas the ‘plateaus’ introduce altitude rises.
- A characteristic of these anomalies are that they seem to be ‘washed out’, meaning that they are uniformly distorted with evident boxy stitching lines.
Pros
- Clearer demarcation of paths further up the slope (line splits brown in top right).
- Quick flight and processing time.
- Sensitive to close canopy. Cannot ‘see through’ to the underside.
Pros
- Minimum washed out area compared to others (least red box area)
- Still some wash out at high trees.
Pros
- Clearer terrain details (more terrain lines in blue section on left of plot)
- Longer flight time, more processing and data handling cost.
- High trees may get washed out as seen here.
PROCESSING COMPARISON
Below are the reports generated by WebODM which gives us useful contextual data to compare.
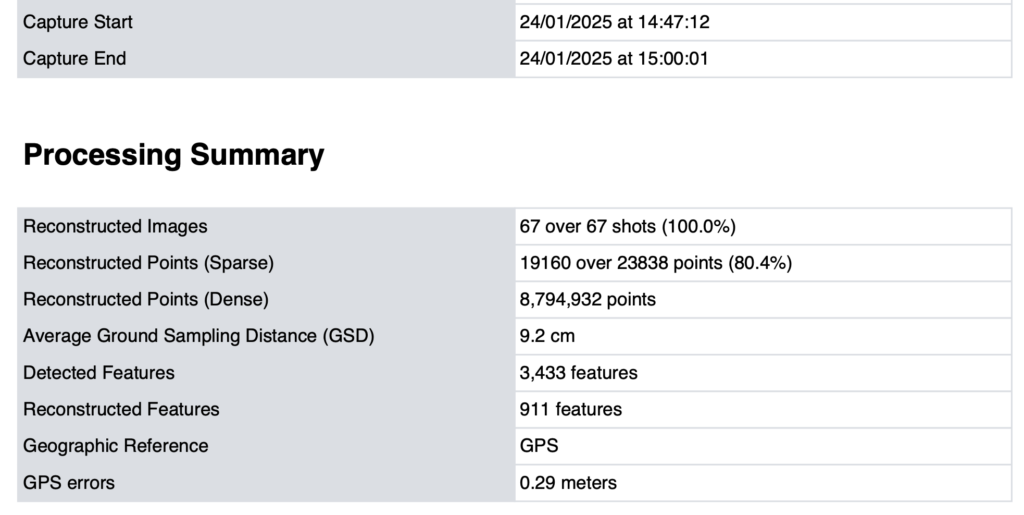
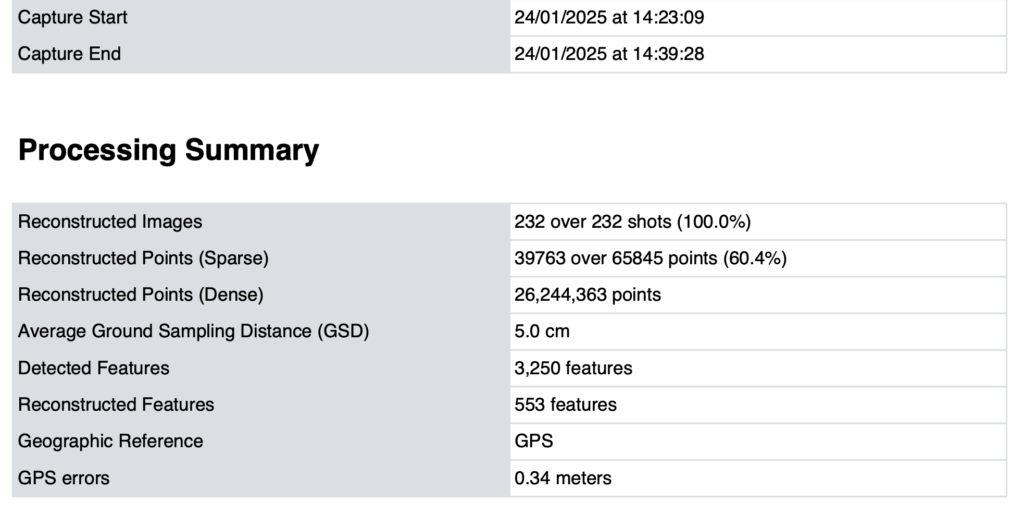
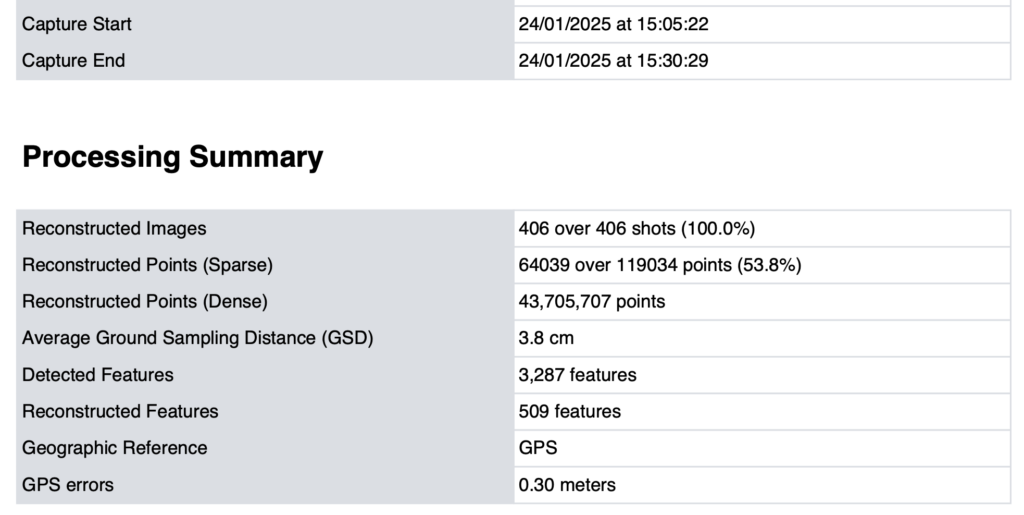
- RTK was not used and the GPS errors seem to be about 30 cm. Using RTK we can expect accuracy to improve to between 5 cm to 15 cm.
- Compared with 400 ft : 200 ft uses 4 times more pictures, and 150 ft uses 6 times more.
- Flight duration: 400 ft took 13 mins, 200 ft took 16 mins, 150 ft took 25 mins.
Digital Surface Model (DSM)
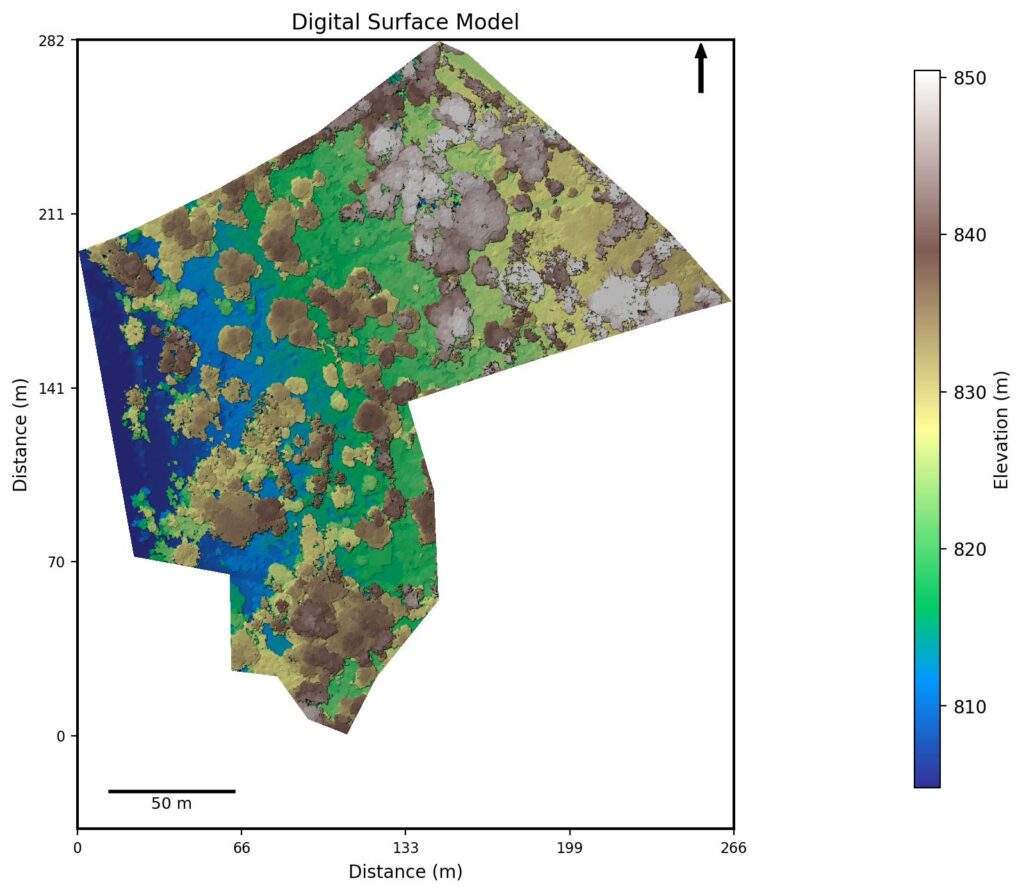
There is not much difference in the DSMs of the different flight altitudes. This is because the software does not need to ‘see through’ between the canopy as it did in the DTM. The DSM is useful to estimate the extent and height of the canopies and other top surfaces.
- Tree height in the section where 200 ft DTM got washed out: 850 mt (canopy altitude) minus 825 mt (ground altitude from DTM) = 25 mt. About 80 ft.
- At 200 ft drone altitude the tree canopy got only slightly washed out. So at 200-80= 120 ft above the canopy there is still chance of wash out. Hence for accurate DTM using 70/80 overlap, let us fly at least 130 ft above the highest trees.
- Also in this DSM we can notice the closed ‘tight’ canopy at the place where 400 ft DTM had an anomaly. The inference here is that you need in tight canopies you want the sunlight to penetrate through between the canopy (mid day at noon or so), and fly at a lower altitude so terrain triangulation from the features work optimally to generate a good terrain model.
ORthoMosaics - RGB and Multispectral
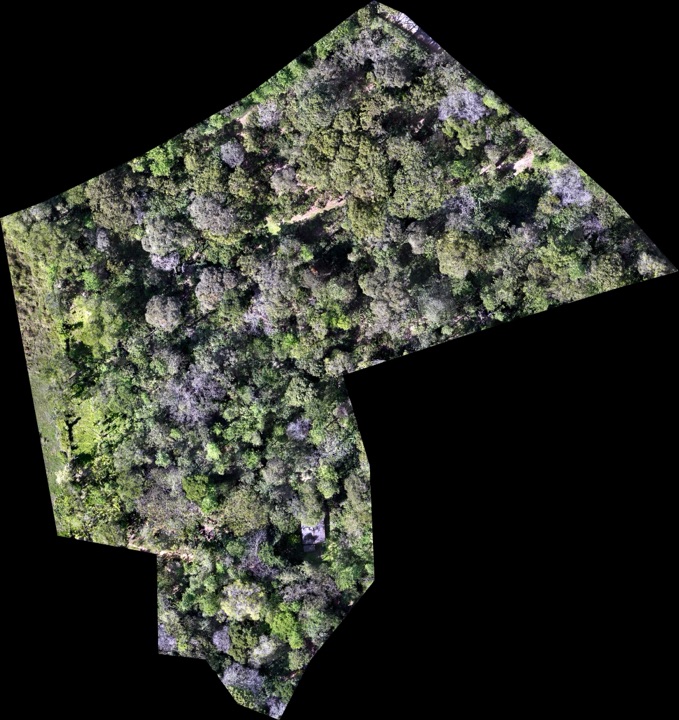
Finally, the RGB ortho, like a regular phone camera photograph taken from the sky, gives a human visual reference of the land. This is akin to a google satellite view, but with much higher resolution that can be used to zoom in and also identify tree species and other details. We are working on automatic analysis of such data and hope to offer you the service soon. Until then, may this serve as a good visual cue for understanding the lay of the land and manually inferring information about it.
The Multispectral cameras can pick up on Near Infra Red (NIR) and Red Edge (RE) colour bands which are not visible to the human eye. Crop stresses can be identified using these bands through creating vegetation indices such as NDVI where ‘green’ colour indicates healthy vigorous plants and ‘red’ tends towards non-living matter such as soil. We can use this similar to how we visually inspect healthy and unhealthy plants – bright greens indicate health and yellowness indicates stress due to disease or pests.
Conclusion
From the above exploration we can infer and recommend the following best practices for surveying area with the drone, especially in agricultural areas with dense vegetation.
- A digital terrain model is essential for calculating area of the land. This ensures the slope is properly accounted in the land surface area calculation.
- Fly at mid day so that sunlight can penetrate more of the canopy and result in better DTM processing. Also avoid flying too high as this may prevent accurate triangulation of the terrain surface.
- Fly at least 130 ft above the tallest trees or objects, with 70/80 image overlap.
- Use ‘terrain follow’ mode if possible, to maintain GSD (ground sampling distance), in sloping land areas. This means the drone will follow the slope of the land, maintaining the set altitude across the land. In this land example, the difference between the highest and lowest parts of the land are about 25 mt which is approximately 80 ft. So if the drone took off at the top of the slope at 400 ft altitude, it would have mapped the lower sloping parts of the land at 400 + 80 = 480 ft.
- If you had to go with a fixed altitude (without terrain follow) in a land where the highest trees were 80 ft high, set flight altitude between 210 ft to 250 ft.

